Katherine Stolin[1]
, Charles Kennedy[2]
, Rastislav Ivanic, PhD[3]
Abstract
Matrix question format is a popular method used in online surveys to shorten the time respondent takes to complete a questionnaire. In this study, we explored whether the format of the matrix question has an impact on the data collected in a survey and if it creates a detectable bias. In this study, data from two parallel studies using two different online survey platforms were collected and compared. Based on this data collected, we observe that table format of a matrix question appears to push respondents toward the center of the response scale. The impact is relatively small on average, but it varies greatly based on the question.
Introduction
When building online surveys, one of the strategies researchers use to reduce the length of interview (LOI) is employing matrix questions in a table format. Rather than asking a sequence of individual questions with the same response scale, a matrix question builds a table with questions as its rows and scale answers as its columns. Such table is then presented to the respondent who can quickly mark their answers on the same page, thus saving time.
Matrix questions, however, do pose several potential disadvantages. We have conducted an experiment to test two of these issues. Primarily, we attempt to determine if showing matrix questions in a table form may cause a drift toward the middle of the answer scale. Additionally, we consider whether a table format of matrix question encourages straight-lining (i.e., selecting the same response for all rows of the matrix). Other potential pitfalls of matrix questions which we did not explore in this study include priming respondents by showing multiple questions at once or respondent fatigue.
Data and methodology
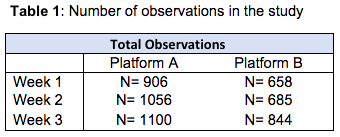
In this study, we conducted two identical surveys on two different platforms. The surveys were set-up as ad perception tests with six different stimuli representing six different ads presented to respondents as nine-image grid images. Platform A used a traditional table matrix style where sets of questions were presented at once on the screen. Platform B separated individual questions and presented them one-by-one to the respondent. Both surveys asked the same 15 questions about six different stimuli in a randomized order using the same three-point answer scale. We repeated this experiment three times in three consecutive weeks. There was no re-sampling or respondent panel, which was sourced by the same panel provider using the same methodology each time. Total observations for each of the six surveys was between N=650 and N=1100. Please note that N represents number of times a matrix question was answered, not the number of respondents. Respondents were randomly shown five out of six stimuli for each week of this study.
Experiment 1: Week by week analysis of mean scores
In the first experiment, we were interested in understanding whether two different methods of presenting a matrix questions resulted in different average scores for the same stimulus. Specifically, we hypothesized that that average scores collected using the table format would result in scores closer to the neutral value of the scale. In this study, this neutral midpoint was the score of “2” or “No change” on a three point scale.
In this experiment, we tabulated answers for each question for each stimulus by week. Responses followed a three-point scale representing perception of the stimuli. The scale reads as follows: A numeric value of 1 (Improved perception), 2 (No change in perception), and 3 (Worsened perception). An average score of 2 would suggest that, on average, the stimuli did not change respondent’s perception of a brand, while an average score closer to 1 would indicate that most respondents felt the stimulus improved their perception of the brand.
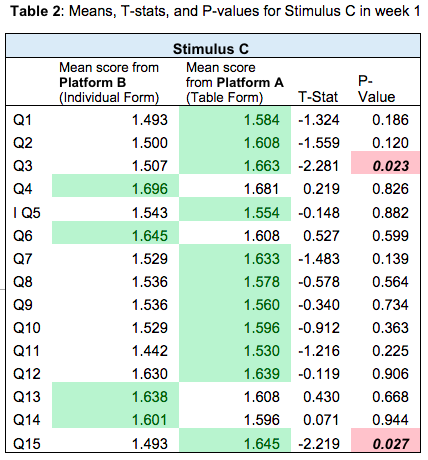
Table 2 is an example of how we analyzed each week’s results in total, by stimulus. This table represents results for stimulus C in week 1. We have the mean response for Platforms B and A, and the t-test results which detect significant difference between the means. You may notice that the means range between 1.5 and 2. Greater average value between the two platforms is shared in green, and p-values are highlighted in red if they were statistically significant.
The following table summarize average scores for each question for the two methods side-by-side, identifying where statistically significant differences were observed at 90% confidence level or better.
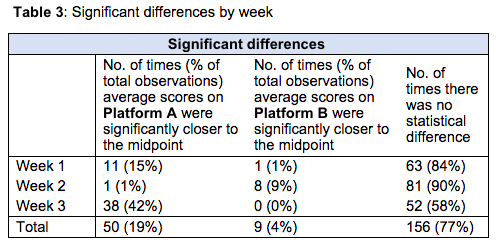
In about three quarters of the observations, there was no statistical difference in the average scores between Platform A (questions presented in a table form) and Platform B (questions presented individually). However, when there was a difference, the answers were closer to the midpoint (value of 2) 85% of the time (50 out of 59 cases) for Platform A (questions presented in a table form). The average statistically significant difference observed between Platform A and Platform B was 10.09% (or 0.165 points on a three-point scale) for the 50 observations where Platform A were higher and 9.13% (or 0.142 points on a three-point scale) for the 9 observations when Platform B answers were higher.
While the majority of observations (77%) do not show statistical difference between the two approaches, there is some evidence that when there is a difference, presenting questions in a traditional table matrix more often leads to a score closer to the midpoint.
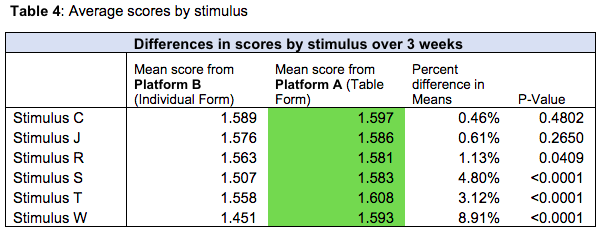
Interestingly, there appears to be some evidence that a drift toward the midpoint answer in the table matrix varies depending on the stimulus. The following table summarizes differences in mean values for individual stimuli with data aggregated across 3 weeks.
Experiment 2: Aggregate analysis across all questions
From the analysis of individual matrices in the previous section, it becomes evident that there is a noticeable “drift” of scores toward the average when questions are asked in a traditional table form.
To confirm this hypothesis and to validate that there is a persistent bias toward the middle answer as a function of the survey format, we aggregated all responses across all questions for the two platforms. If there is indeed a bias as a function of the form in which matrix question is presented to the respondent, we would expect to find a difference in the means of scores between two platforms, with Platform A means being closer to the value of 2.
Aggregating all data across questions and weeks resulted in a statistical test with about 80,000 observations. The average difference in mean score between Platform A (traditional table) and Platform B (questions presented item-by-item) was 2.54% which represented a difference of about 0.04 points on a 3-point scale. This result was statistically significant thus confirming our findings from the previous section.
Discussion
Based on the data in our study we observe that presenting matrix questions in a table format, where the table is visible to the respondent all at once, tends to push the average score of the response toward the midpoint. Using a three-point scale, the difference in average score was small (2.54%, corresponding to about .04 points on the scale), but very significant in aggregate. Interestingly, these results are stronger for some stimuli than for others. Stimulus W, for example, generated a 9% difference between average scores, while stimulus R resulted in a difference of less than 2%. More research needs to be done to help us understand what aspect of the stimulus specifically causes stronger drift in the answers.
Further research
As we have noted above, we see emerging evidence that traditional table matrix skews results toward the middle answer. We note that while evidence presented in this paper is based on a substantial amount of data, it is based on one study design and it should be repeated with a different set of questions to validate these findings. Namely, our experiment should be repeated with scales in reverse order to confirm that table matrix average scores still show the drift toward neutral.
Additionally, in future research, we will explore an impact of additional factors on this emerging bias: type of stimulus, length of the matrix question, range of answer scale, length of expected LOI and impact of respondent panel quality.
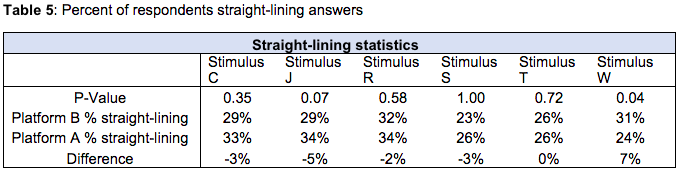
Finally, while this was not a major focus of this study, we have briefly visited the topic of straight-lining to explore if there is any indication that one form of matrix question is more prone to straight-lining. Results from our study do not show significant difference overall, but there again appear to be some differences depending on the stimulus presented to the respondent. Future research could explore the propensity to straight-line depending on the type of question or stimulus presented. Additionally, an important factor that could influence propensity to straight-line is the length of the matrix. Our hypothesis is that the longer the matrix table presented to the respondent, the more likely respondent is to straight-line answers to get to the next question.
Note: This is a working paper and part of ongoing research. Please do not hesitate to reach out if you have any comments or questions.
[1] GroupSolver, San Diego, CA, USA
[2] GroupSolver, San Diego, CA, USA
[3] Corresponding author; ivanic@groupsolver.com
, GroupSolver, San Diego, CA, USA