GroupSolver’s QuantQual™ approach easily connects the ‘what’ to the ‘why’ to reveal the full story behind your toughest research questions. The unique quant and qual platform quickly finds the underlying drivers with the greatest impact on the metrics that matter most to your business.
In this article, we’ll explore the power of QuantQual™ in three practical research examples. They illustrate the breadth of application this approach offers to marketers and business leaders who want to dig deeper and make their products and marketing campaigns more successful.
The better we understand our customers, the easier it is to create products, campaigns, and experiences that stick and that our customers love.
Consider some of the world’s most recognizable brands: Apple, Amazon, and Starbucks. These brands are successful not because they were the first ones to invent cell phones, online shipping, or coffee, but because they understood what makes their customers fall in love with their offering and put that understanding at the center of their businesses.
Putting the customer first has proven to be a successful strategy, but the challenge for companies starts with understanding what their customers truly value and are willing to pay for. Most companies recognize the need to hear the voice of their customers in as close to their own words as possible, but this is a difficult task using traditional market research approaches–particularly at the scale needed for the insights to be reliable.
Researchers typically have two options for collecting feedback that allows consumers to express themselves in their own words: conducting in-person focus groups or using open-ended questions in surveys. The problem with both approaches is that we end up with unorganized, subjective feedback that is difficult to quantify and scale. These limitations often lead to companies relying instead on quantitative research, which is easy to scale and analyze, even if it comes at the cost of losing the true voice of the customer in the process.
With QuantQual™ you can see the direct connection between consumer-generated qualitative data, such as customer perceptions and behaviors, and their impact on the quantitative metrics that matter most to your business.
In other words, your brand can quickly identify the most differentiating feedback and how it impacts your bottom line. You can find out exactly what part of your advertisement converts consumers, what keeps customers coming back to your brand, or which employee concerns lead to higher turnover.
What makes this breakthrough approach possible is GroupSolver’s innovation to open-ended questions (called AI-Open End™). This methodology captures individual consumer voices in a conversational style survey, identifies and groups key ideas, and then presents these ideas back to the audience to be evaluated by other participants–creating a dynamic survey within a survey. The result is crowdsourced qualitative insights backed by support statistics that give you confidence in your qualitative learnings.
To explore how the approach works, let’s take a look at three practical examples. We’ll start by diving into the power of QuantQual™ in brand perception, then we explore how QuantQual™ strengthens concept testing, and we will conclude with an employee experience research example.
Connecting Brand Perception to Customer Loyalty
Imagine that you are a large clothing brand. You know that your brand image has a big impact on customer loyalty, and you want to find out which brand perceptions translate to an increased likelihood of recommending the brand. Using QuantQual™, finding the connection is simple.
Let’s dive into how QuantQual™ connects the what to the why with the brand loyalty metric, Net Promoter Score (NPS).
Net promoter score is widely used by companies as a measure of customer loyalty and a benchmark of performance. Applying the metric to a survey is straightforward: you ask respondents “On a scale of 1 to 10 (10 being extremely likely), how likely would you be to recommend us to your family or a friend?”.
The scores provided are used to categorize participants into groups called Detractors, Passives, and Promoters. Respondents who score between 1-6 are Detractors, these are customers who are unhappy with their experience and are unlikely to recommend the brand. Passives (scores 7 and 8) are customers who are indifferent towards the brand and may not feel strongly enough to recommend it. Lastly, Promoters (scores 9 and 10) are happy, loyal customers that are likely to recommend your brand.
Your brand’s NPS score is calculated by subtracting the percentage of Detractors from the percentage of Promoters.
Calculating the NPS is simple, but what is crucial for your business to know is why customers gave their individual scores. Understanding the drivers behind the score is the first step in the goal of converting your Detractors and Passives into Promoters. In this case, your clothing brand needs to understand how customers’ perception of your brand impacts your NPS.
To reveal the connection using QuantQual™, you simply select two questions: one quant question that uses a scale (in this case NPS) and one open-ended question. We’ll use the brand perception question, “What words or phrases come to mind when you think of brand x?”
The QuantQual™ visualization will then instantly show you the relationship between the NPS (x-axis) and common brand perceptions revealed from the open-ended question (y-axis).
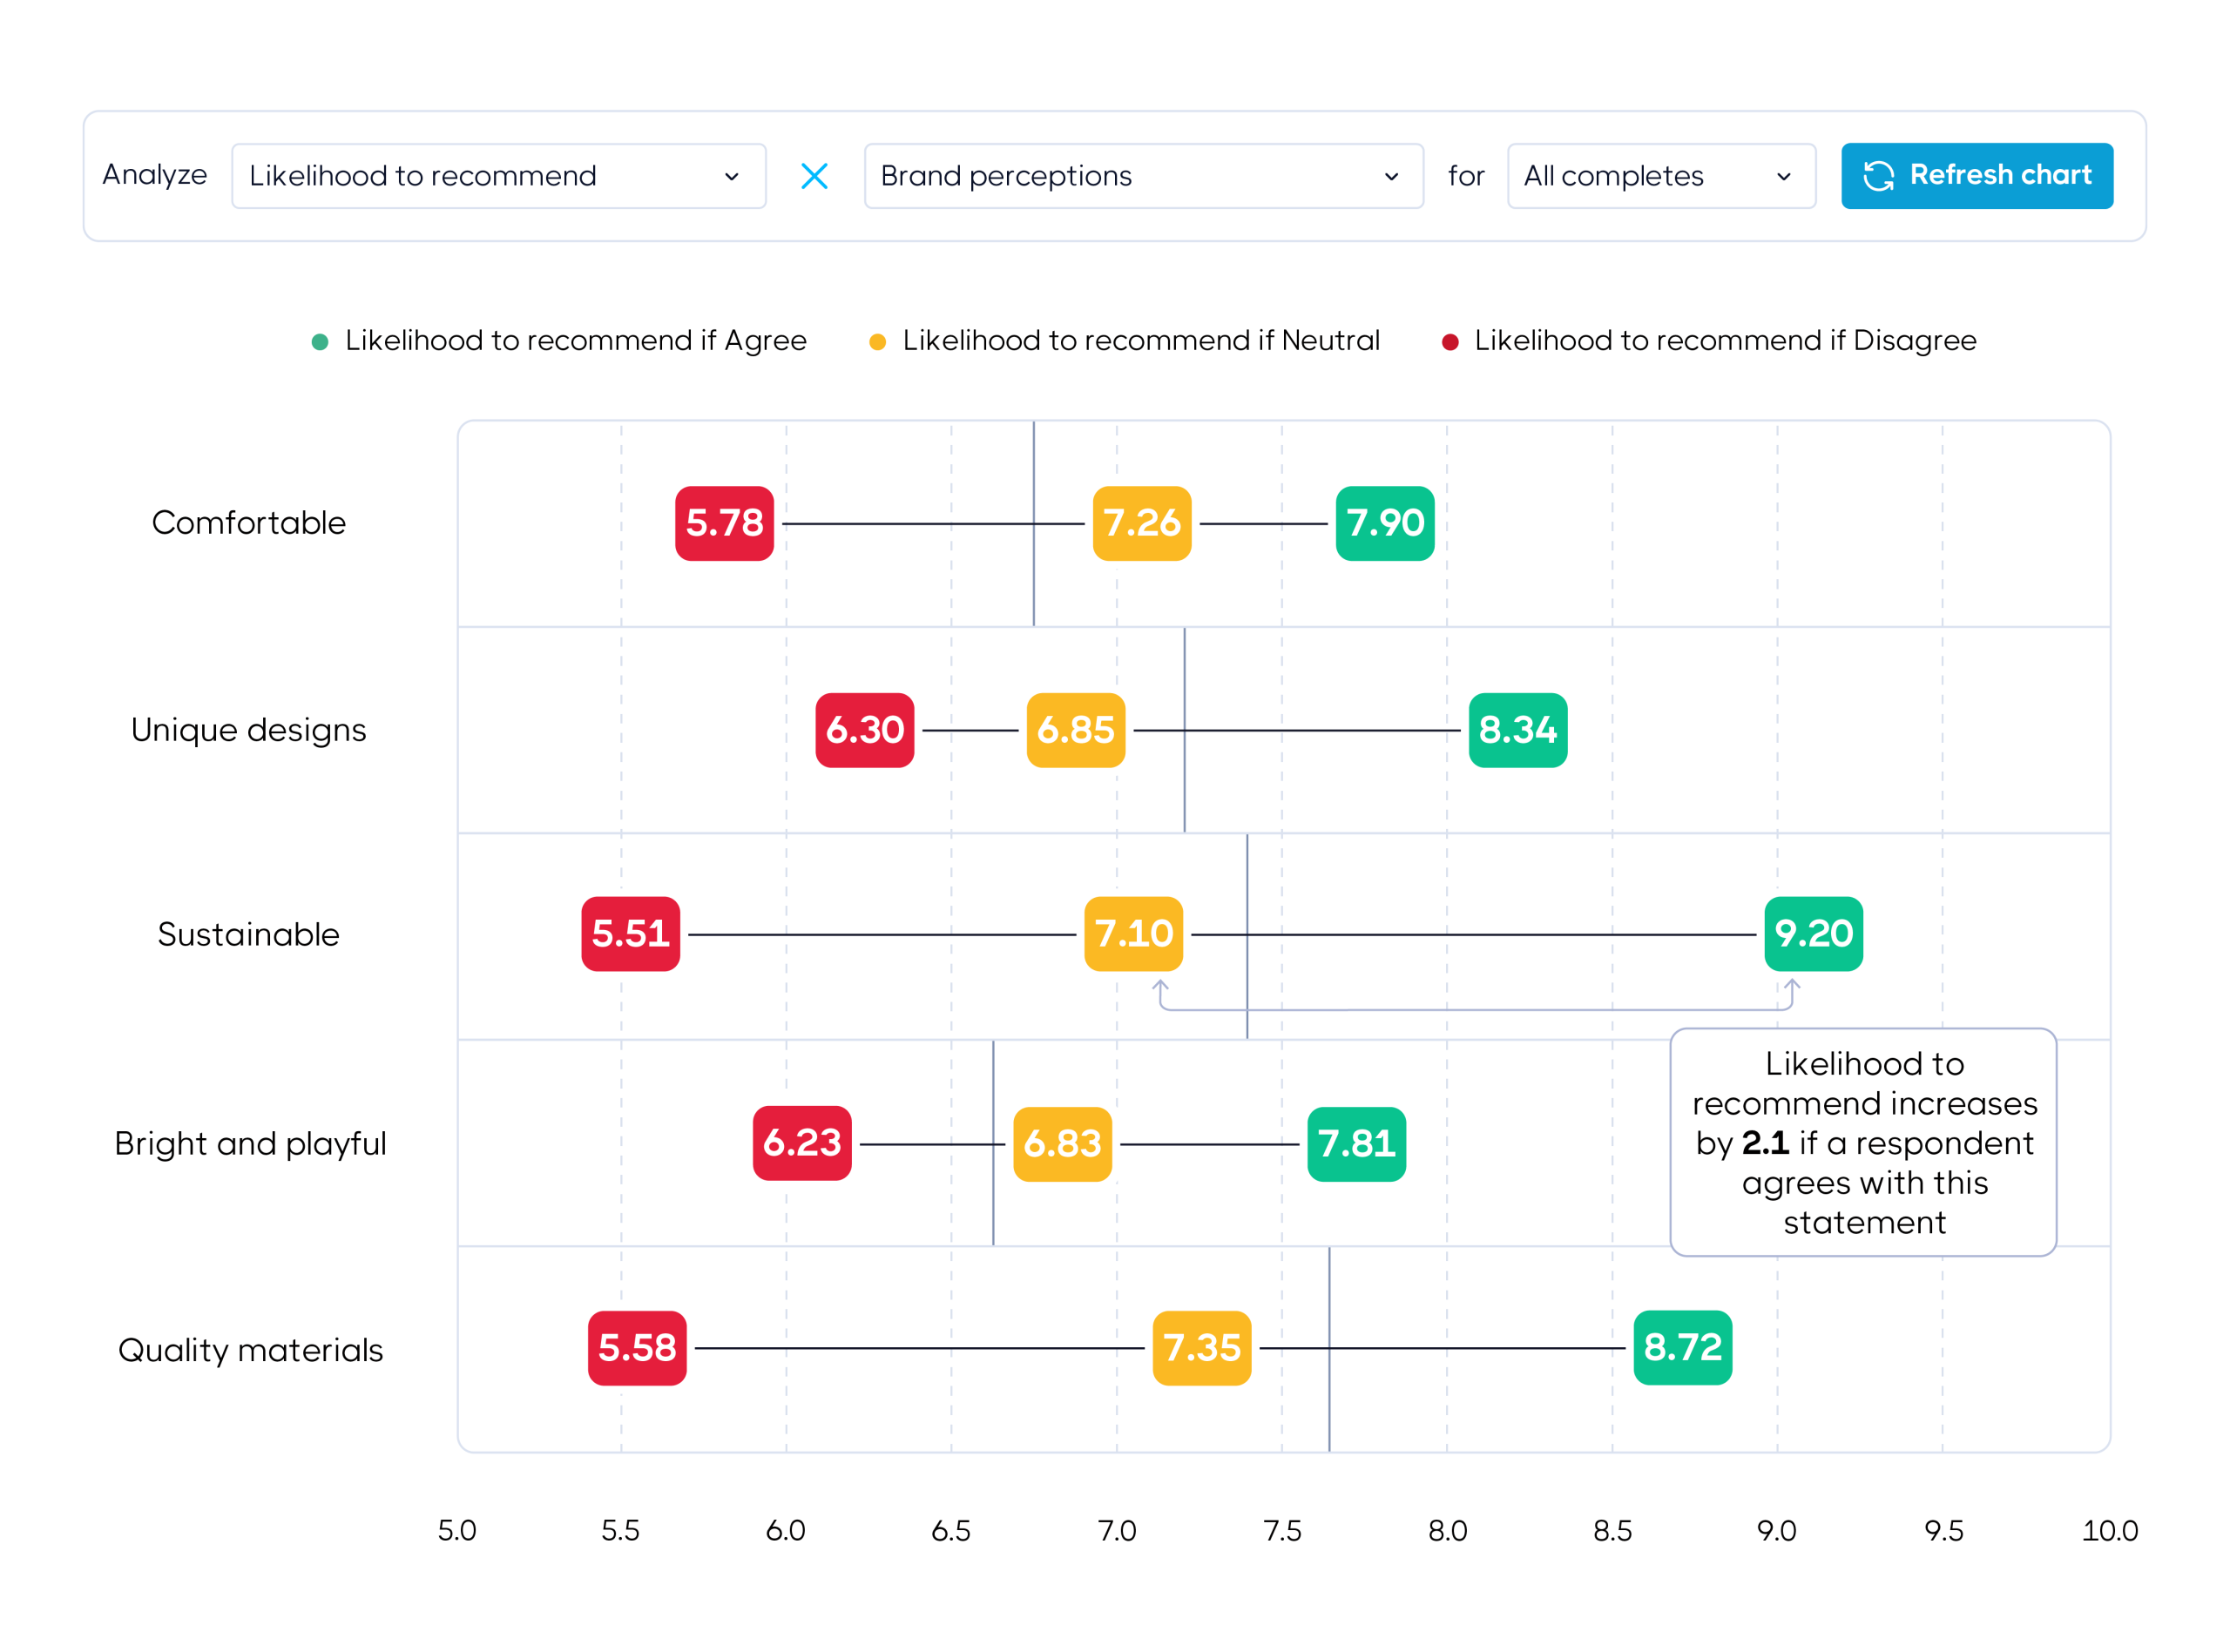
The visualization allows us to see crowd-sourced brand perceptions and how they influence your NPS. The colored boxes show the average likelihood to recommend for respondents who agreed, disagreed, or were neutral on the perception
For example, the average likelihood to recommend increases by a significant 2.1 if a respondent agrees that the brand is “sustainable”.
Before we dive deeper into these insights, you may be wondering: Where did themes like “sustainable” come from?
The answer to that question is what makes GroupSolver’s combination of quant and qual so unique. It all starts with GroupSolver’s innovation of open-ended questions, called AI-Open End™.
The AI-Open End™ approach
As we mentioned earlier, the easiest way to collect qualitative data in surveys is by using open-ended questions. However, traditional fill-in-the-box questions have major limitations that can make researchers think twice about using this approach.
There are two main technical challenges with traditional open-ended questions: Many respondents will simply not answer the question, and others will leave only gibberish, zero-value responses. The result is massive amounts of missing or low-quality data. Furthermore, even quality responses are hard to validate and generalize into larger insights, which results in assumptions or unactionable data.
Let’s break down how the AI-Open End™ approach addresses these limitations through three phases: Ideation, Evaluation, and Synthesis.
Note: Elements of these phases occur simultaneously as the technology works in real-time with the survey.
1. Ideation
In the first phase, called Ideation, respondents are asked to answer an open-ended question in their own words. This allows us to collect unbiased, top-of-mind responses. GroupSolver’s algorithm then filters out the noise, such as gibberish and low-value answers, and groups together answers that convey similar ideas. The result is a clean pool of relevant ideas (a feature called IdeaPool Manager™
).
2. Evaluation
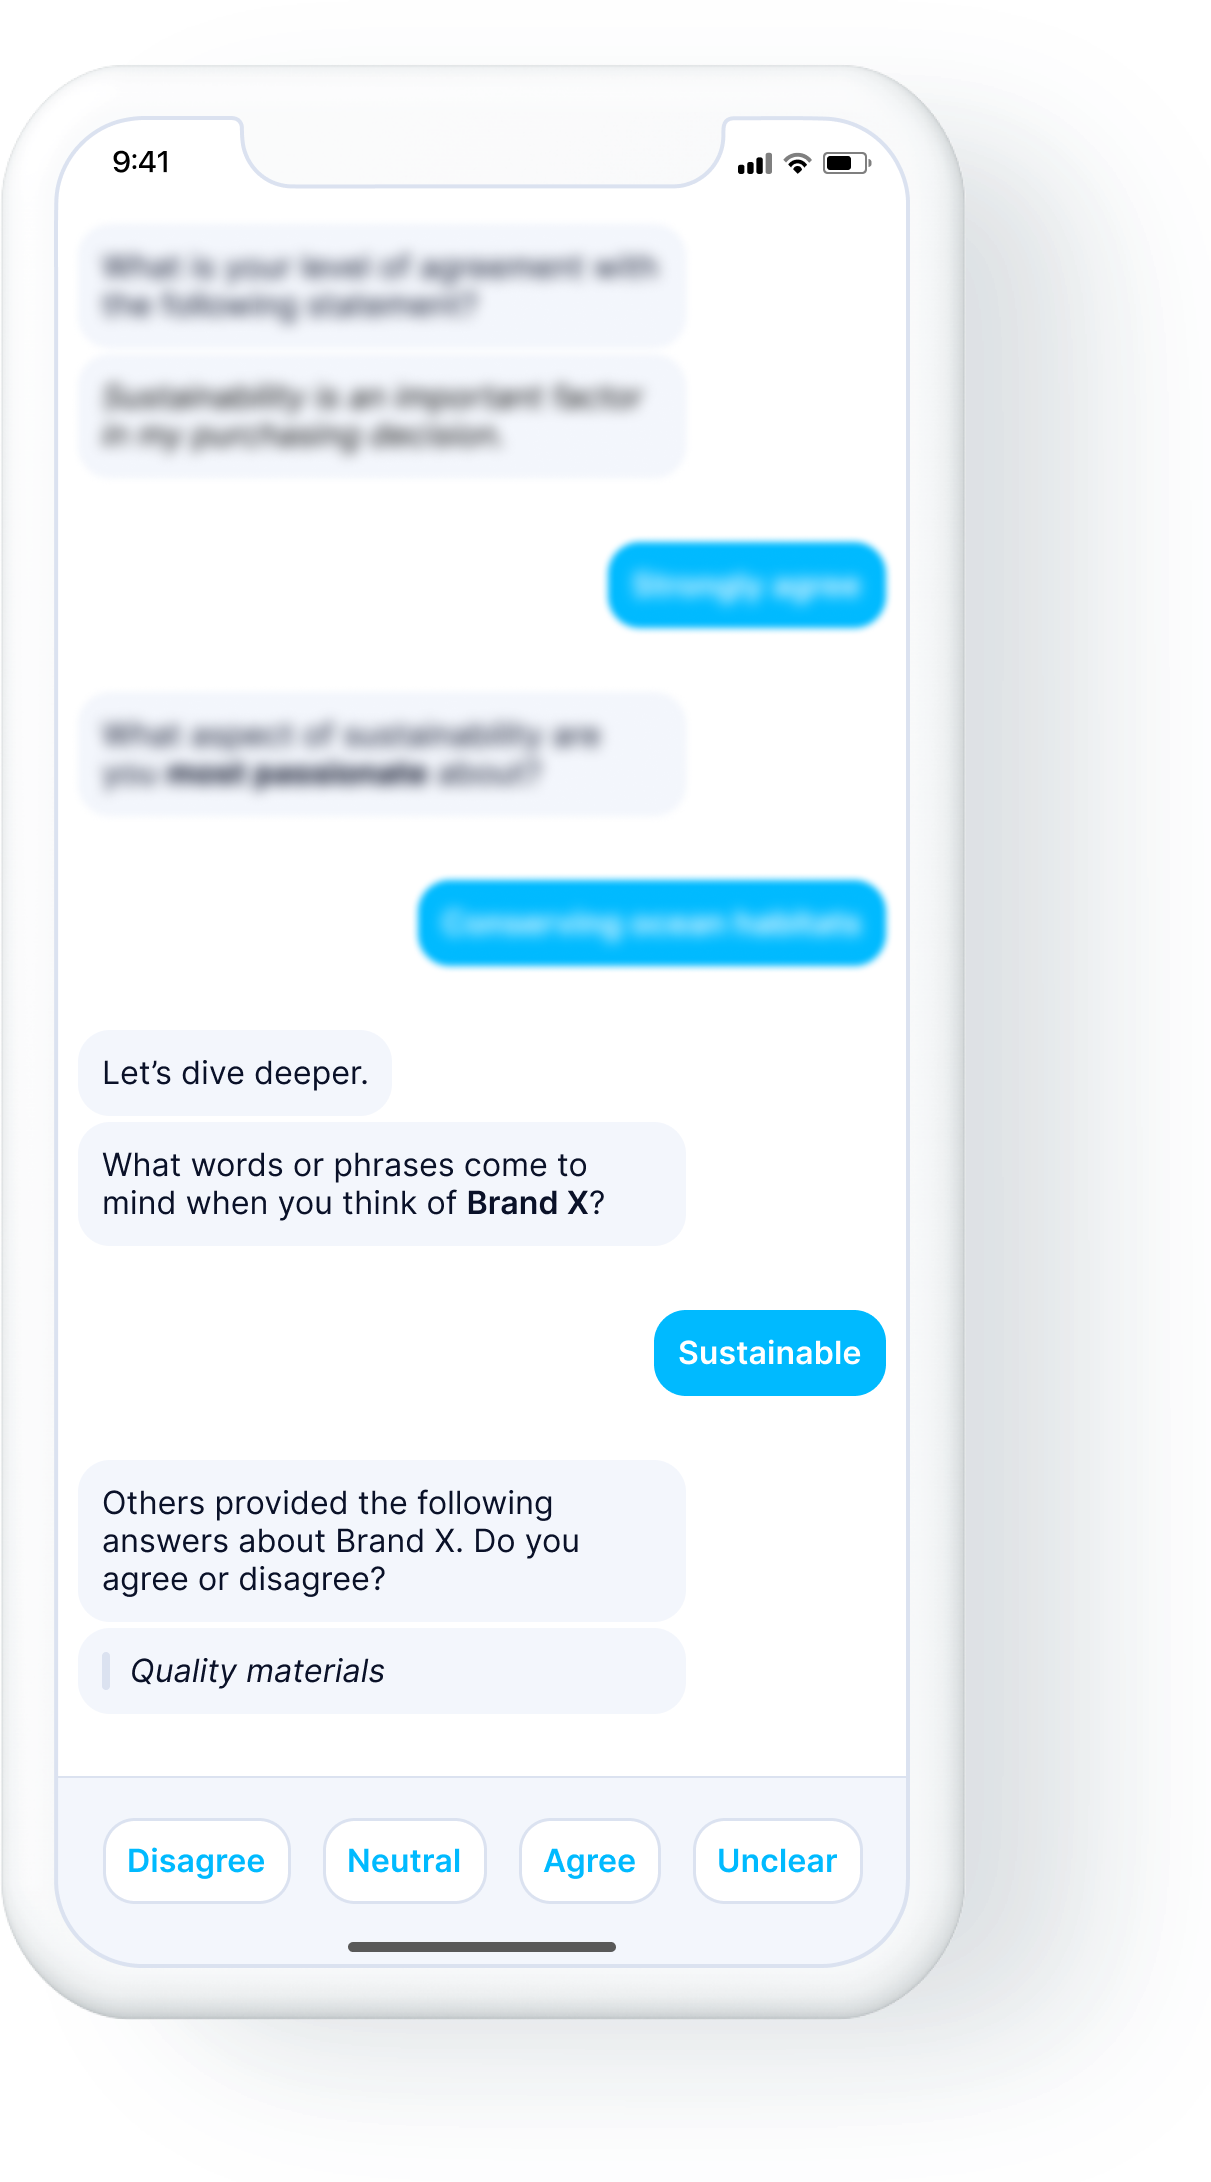
In the Evaluation phase, participants are now asked to evaluate answers provided by previous respondents. The algorithm presents a preselected number of the cleaned-up answers from the IdeaPool™, one at a time, and asks respondents the question: “Others provided the following answers. Do you agree or disagree?” with the options disagree, neutral, agree or unclear as shown in the respondent view below.
This evaluation process accomplishes two critical things to provide researchers better data:
First, we collect data from all respondents. Even if participants don’t provide a free-text answer in the Ideation phase, their opinions are collected when they evaluate ideas provided by others in the Evaluation phase.
Second, because the relevant answers from the Evaluation phase get validated by all respondents, researchers can build confidence in the natural language answers received in the study.
3. Synthesis
In the background of the Ideation and Evaluation phases is a dynamic and self-calibrating natural language processing (NLP) algorithm that automatically organizes common and related answers into themes (a feature called AutoThemes™).
At this stage, researchers can review the automatically generated themes and adjust them as needed. Support strength for these themes is calculated automatically by combining the support of the individual statements within them.
From here, it is easy for researchers to dive deeper into themes and gather significant insights using GroupSolver’s wide range of reporting tools, including the QuantQual™ visualization. These reports can also be used to explore individual, uncategorized statements, based on whichever format is best for your study. We’ll explore this option later in the article.
Now that we’ve taken a look under the hood, let’s return to our QuantQual™ brand perception example.
We saw earlier that customers’ perception of the fashion brand as “sustainable” led to the highest increase in the likelihood of recommending the brand to their friends and family.
Now, let’s look at those who disagreed that the brand was sustainable. Here we see another significant impact on NPS, with a decrease of NPS from neutral of 1.6.
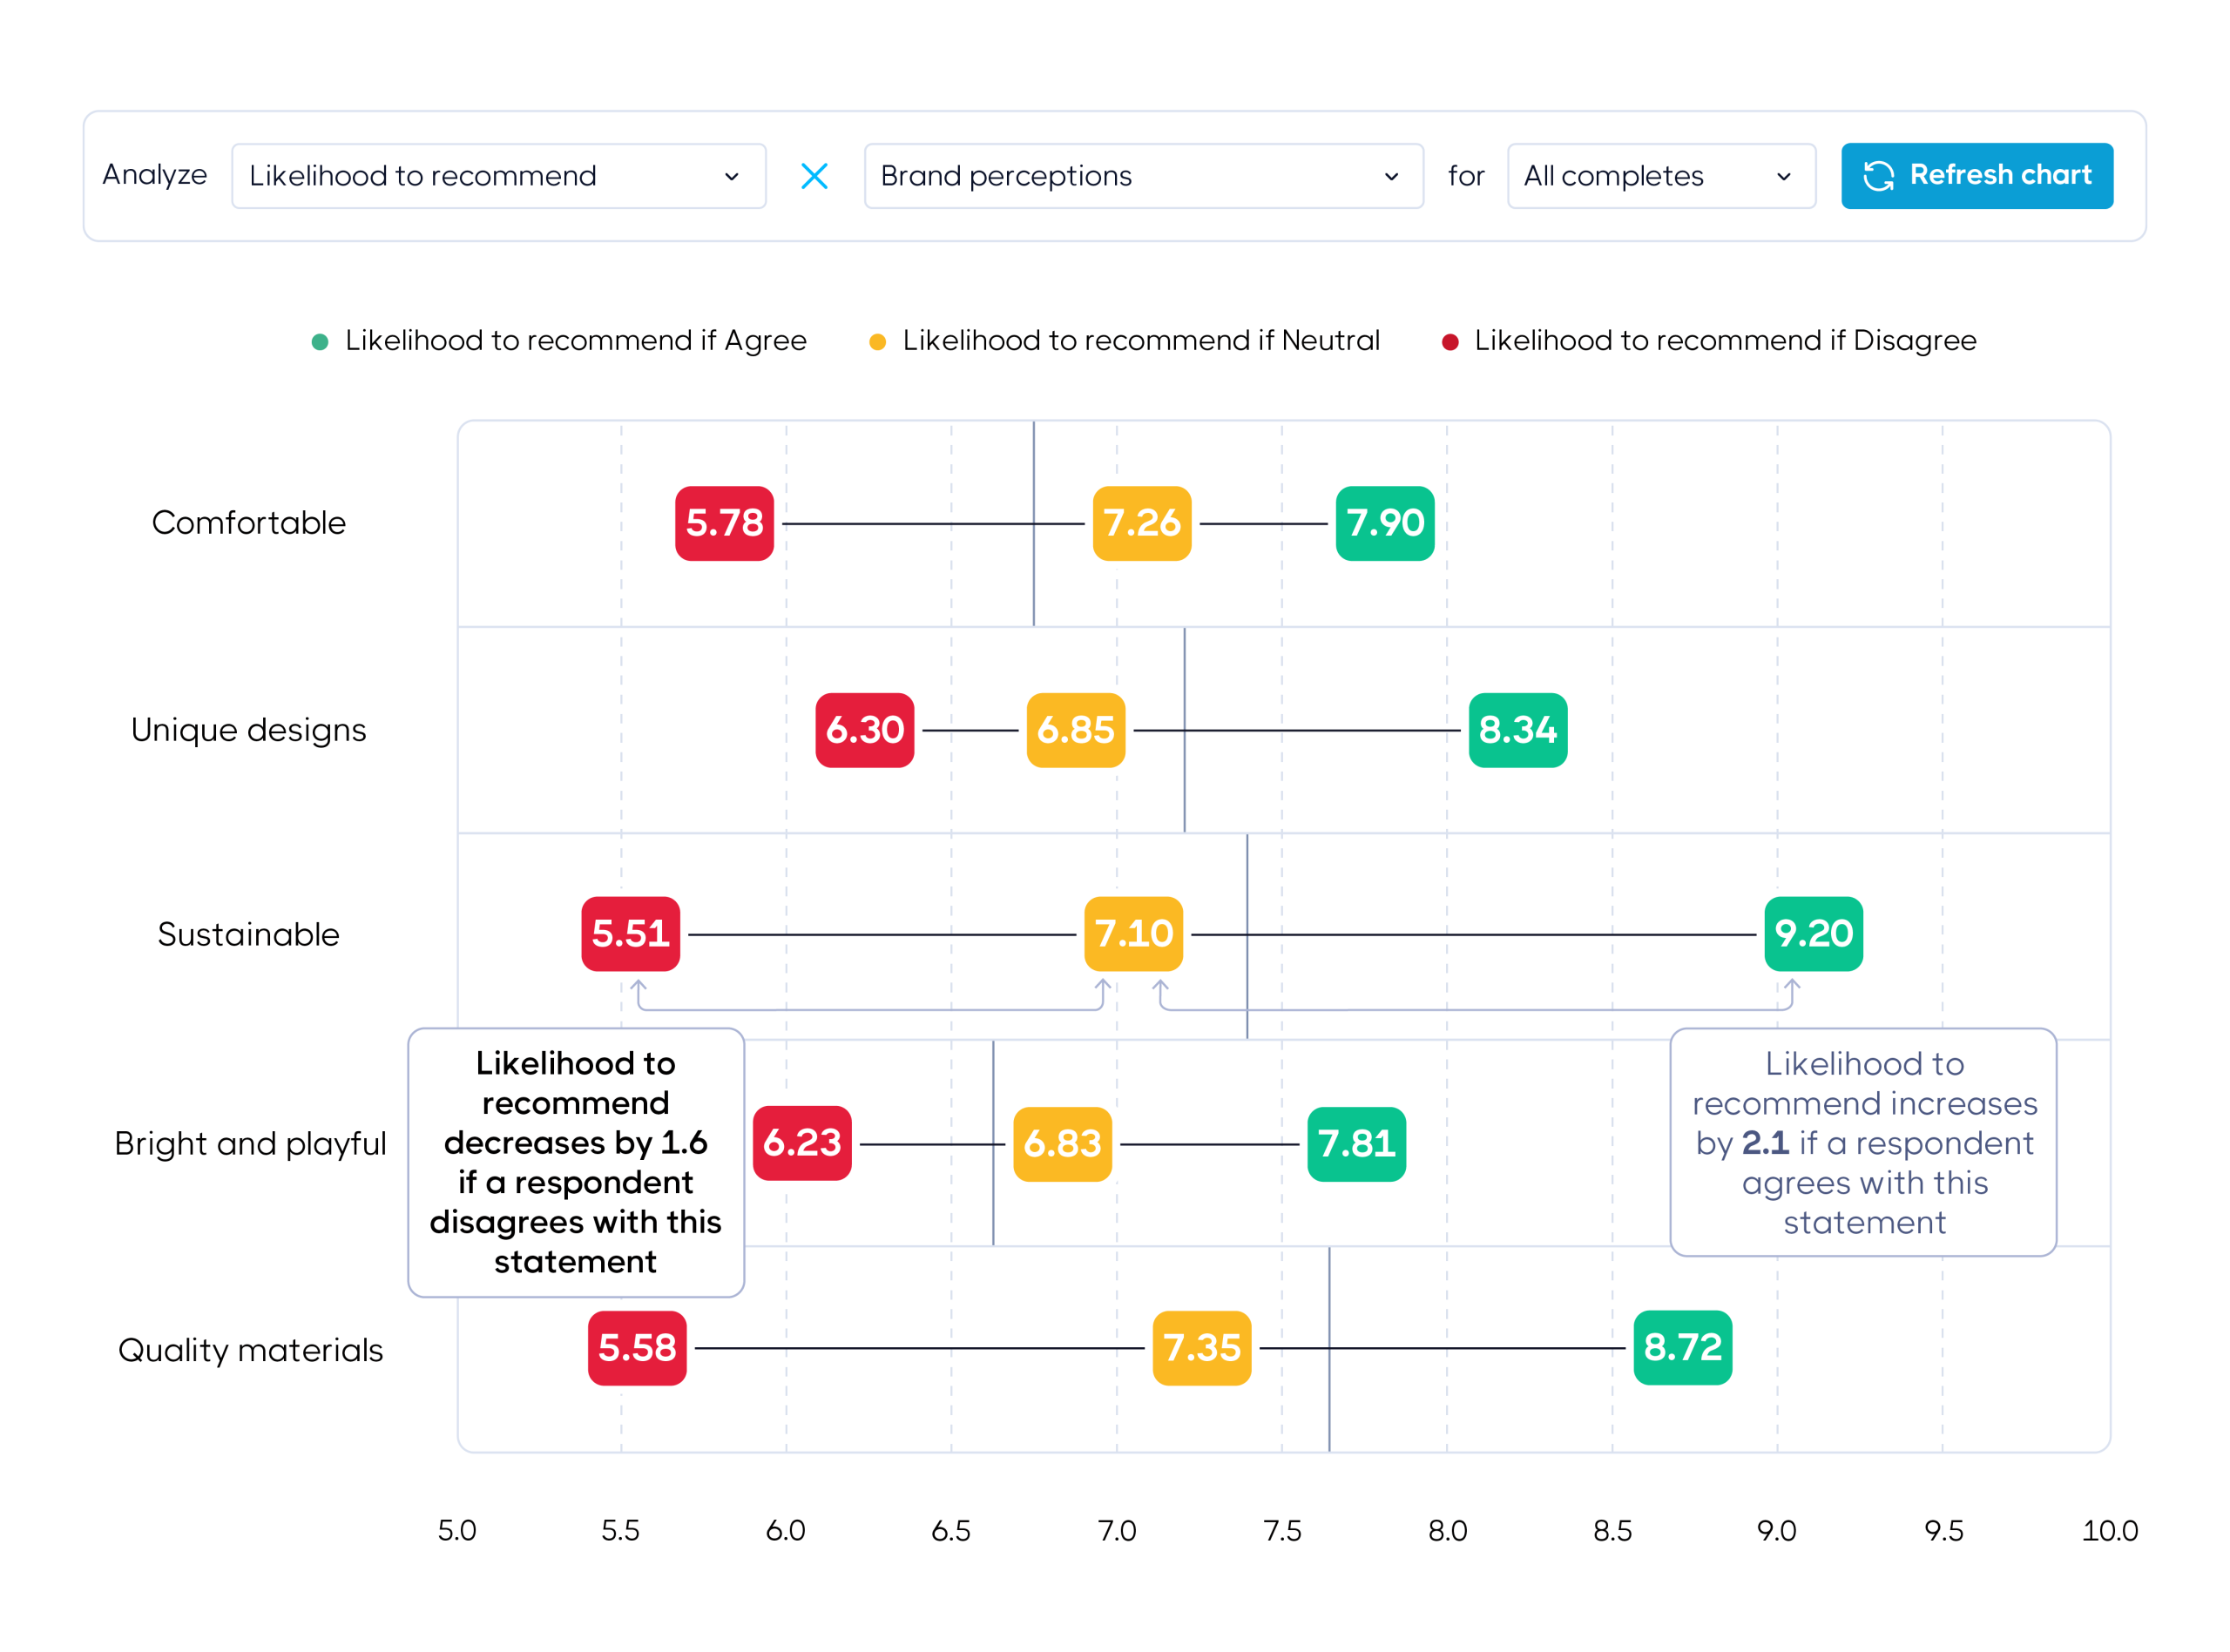
Imagine again that you are a decision-maker for the fashion brand. This significant decrease in the likelihood to recommend shows you exactly how much missing the brand perception of “sustainable” hurts your brand loyalty.
Your marketing team is already promoting your sustainability efforts, so you find that these insights provide two suggestions for action:
Continue investing resources into promoting sustainability
Find ways to make that sustainability information more sincere or credible to convince customers who don’t see your brand in that light otherwise (particularly your Detractors).
Quantifying the impact of specific brand perceptions using QuantQual™ makes it easy to identify the most important perceptions to invest in, so you can turn more customers into Promoters. In the same vein, your brand also knows which perceptions to worry about less.
For example, the likelihood of recommendation stays close to average around certain perceptions like “comfortable” (only a 0.64 increase for those who agree). This indicates that although customers view the clothing as comfortable it’s not the most differentiating reason they would (or wouldn’t) recommend the brand. Perhaps being comfortable is important, but it’s more of an expectation, and therefore isn’t influencing NPS that much.
This provides further evidence for your brand and marketing executives to promote differentiating perceptions such as sustainability more intensively than other factors. Your team decides to continue advertising other top-of-mind brand perceptions identified in the study such as comfort, but not revolve entire campaigns around it.
Identifying Product Use Cases that Increase Sales
In this next example, consider that you are an executive of an electronics brand that developed a new style of earphones. You want to know what occasions consumers would consider using this new product, and how that impacts their likelihood of purchasing it. In addition, you need to compare the use cases and popularity of these new earphones to your older version.
QuantQual™ makes it easy to uncover the why behind respondents’ likelihood of purchasing the earphones, giving your product and marketing teams a clear direction for action.
In a concept test on GroupSolver’s platform, your survey participants are presented with a photo and a short description of each style of earphone and are asked to evaluate them. The following concepts are presented to respondents one at a time:
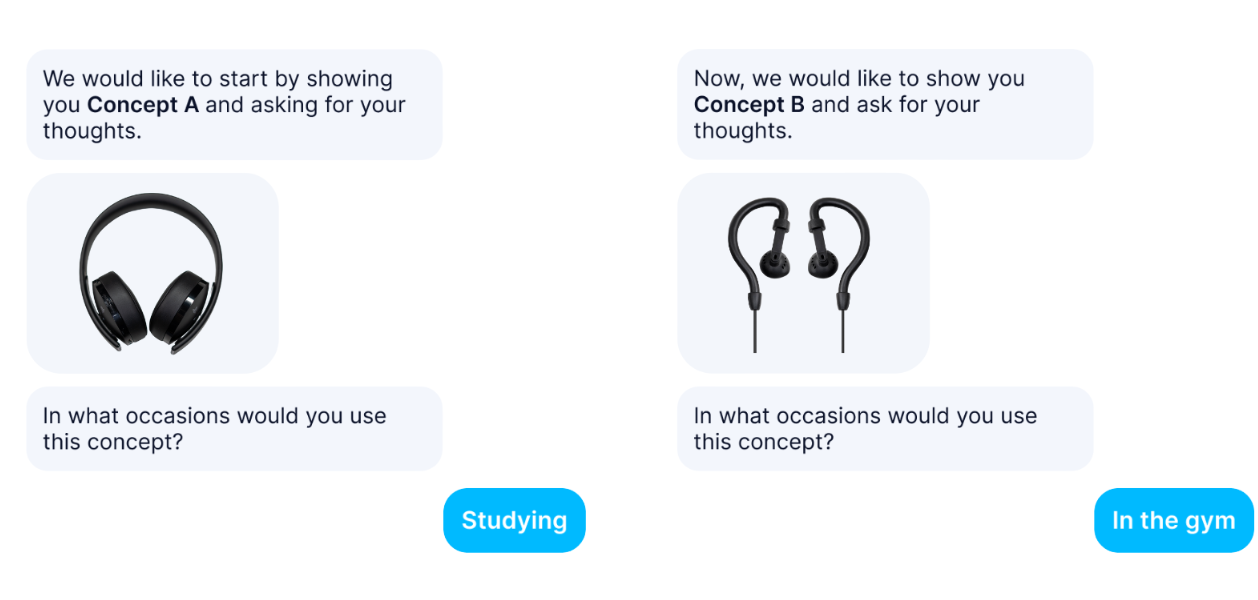
Once the study is complete, you use the QuantQual™ visualization to connect the questions “In what occasions would you use this concept?” and “On a scale of 1 to 7 (7 being extremely likely), how likely are you to purchase the earbuds?” for both concepts as shown below.
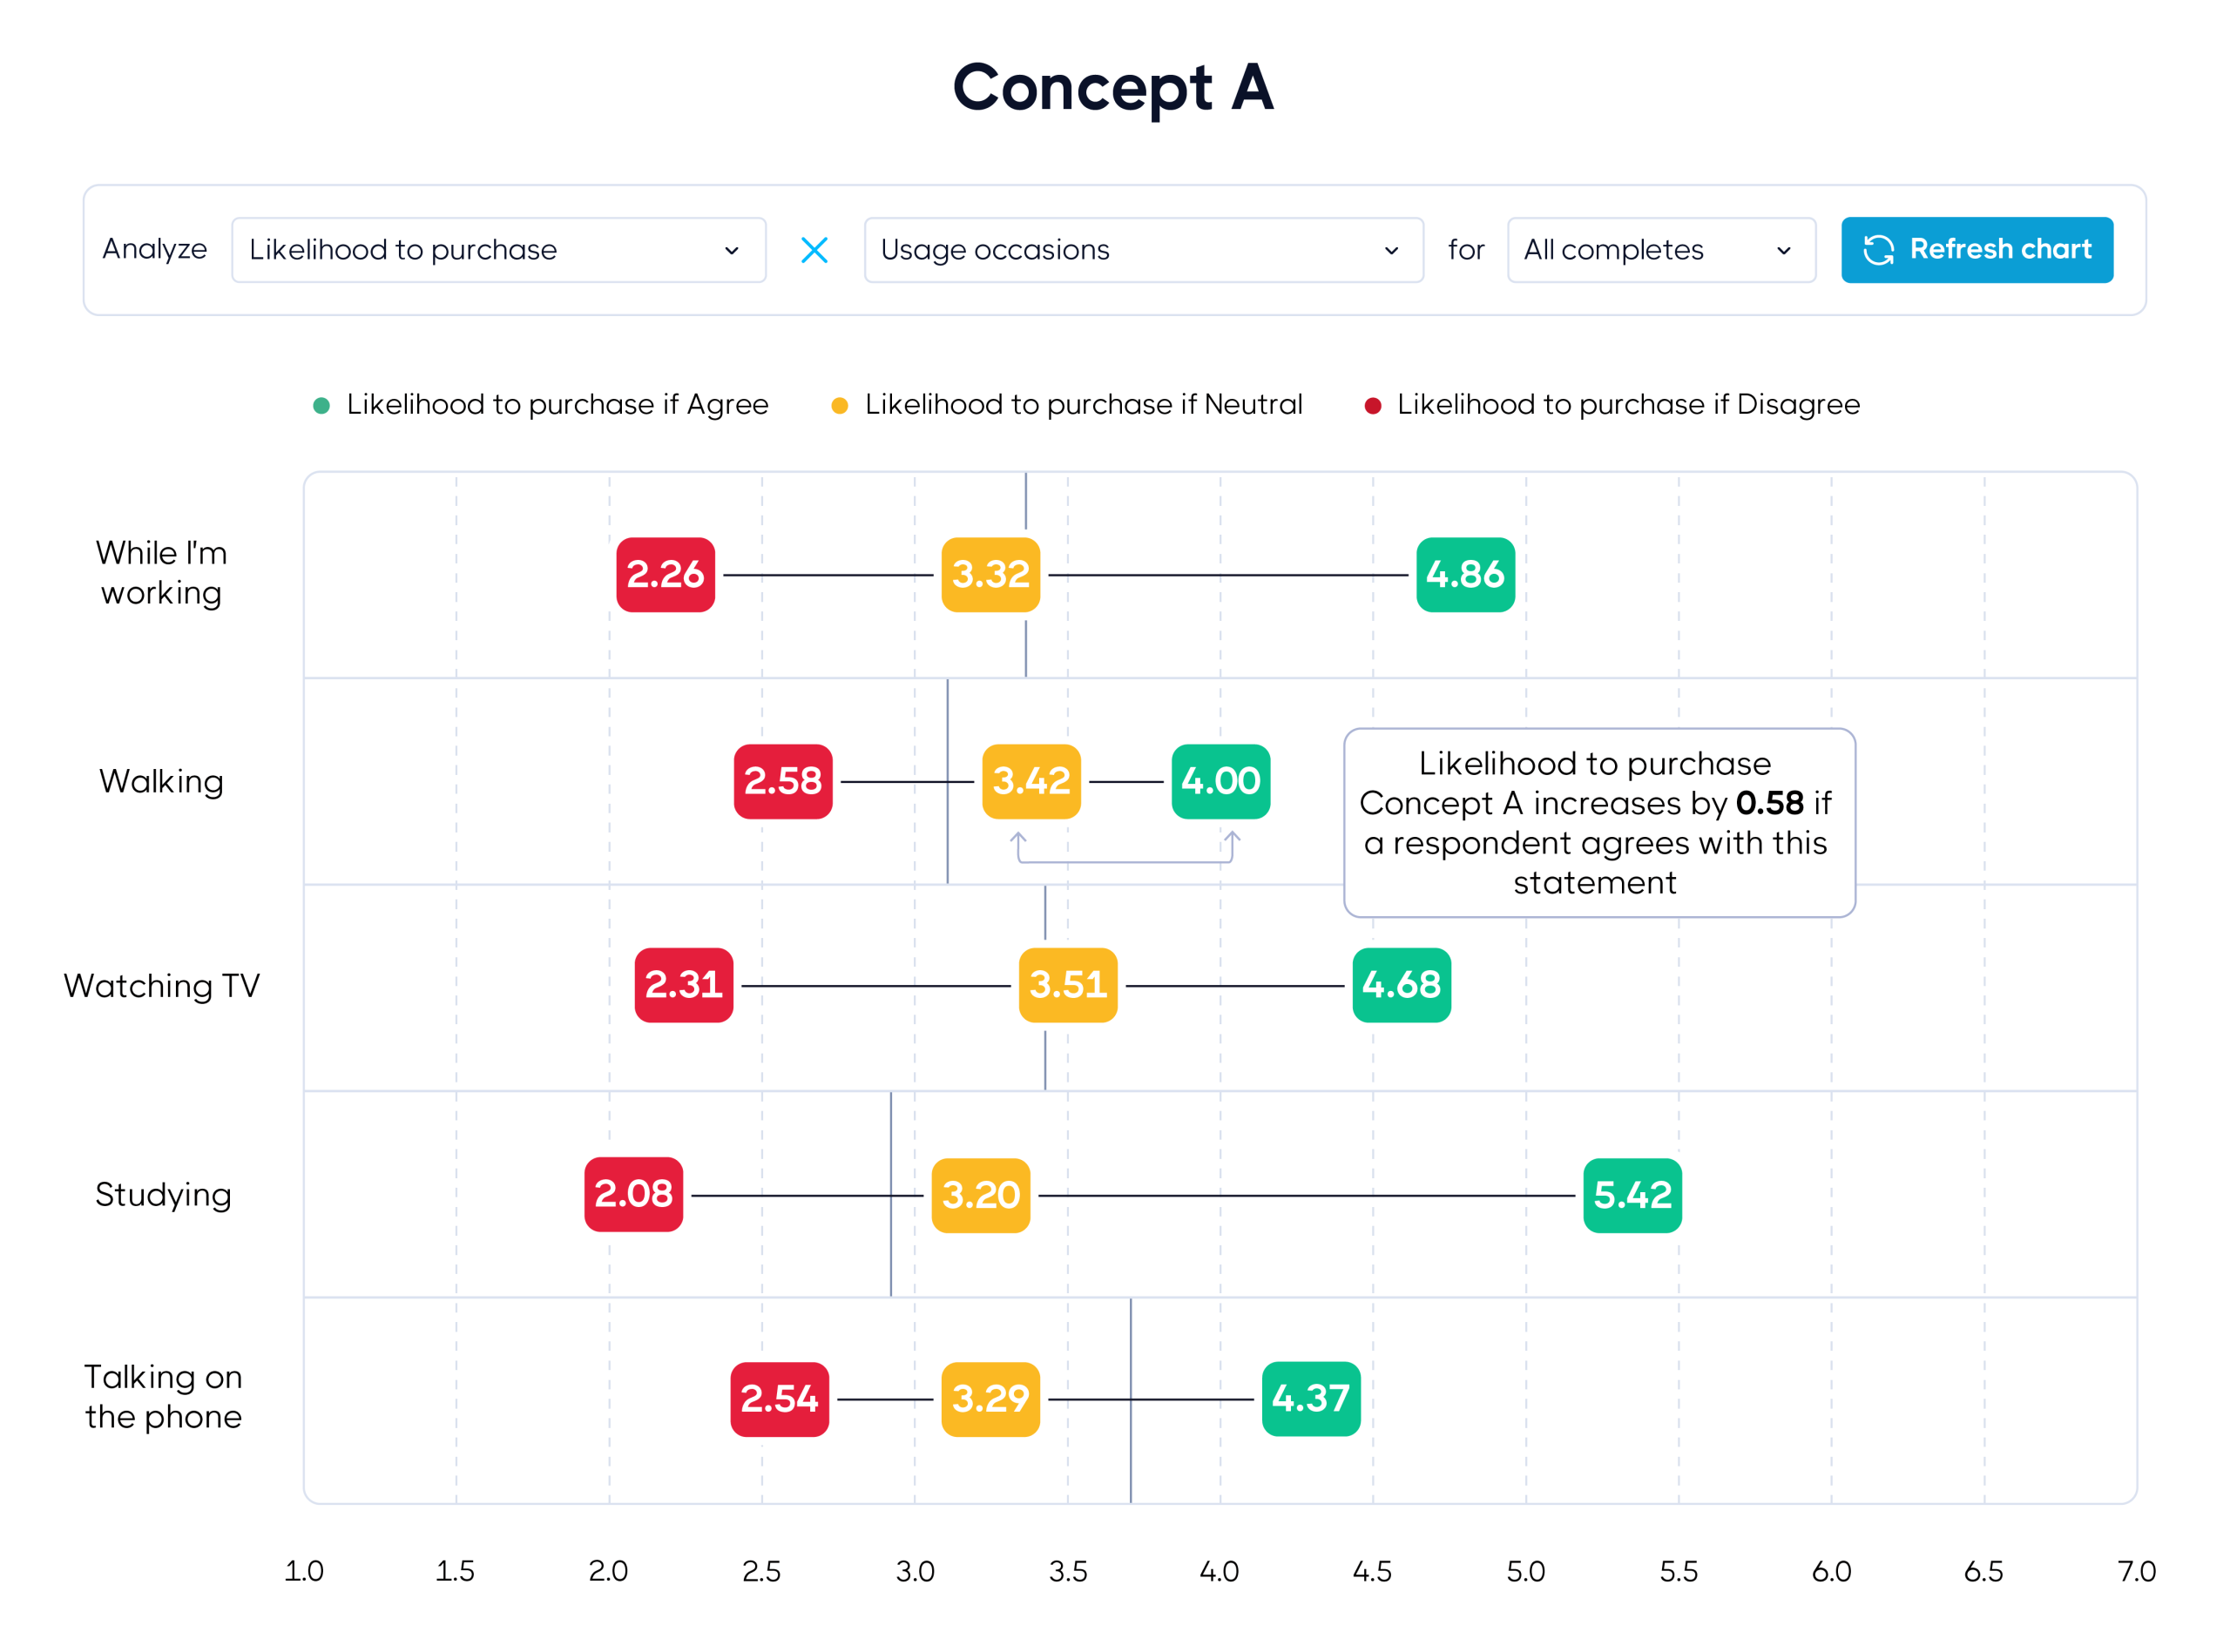
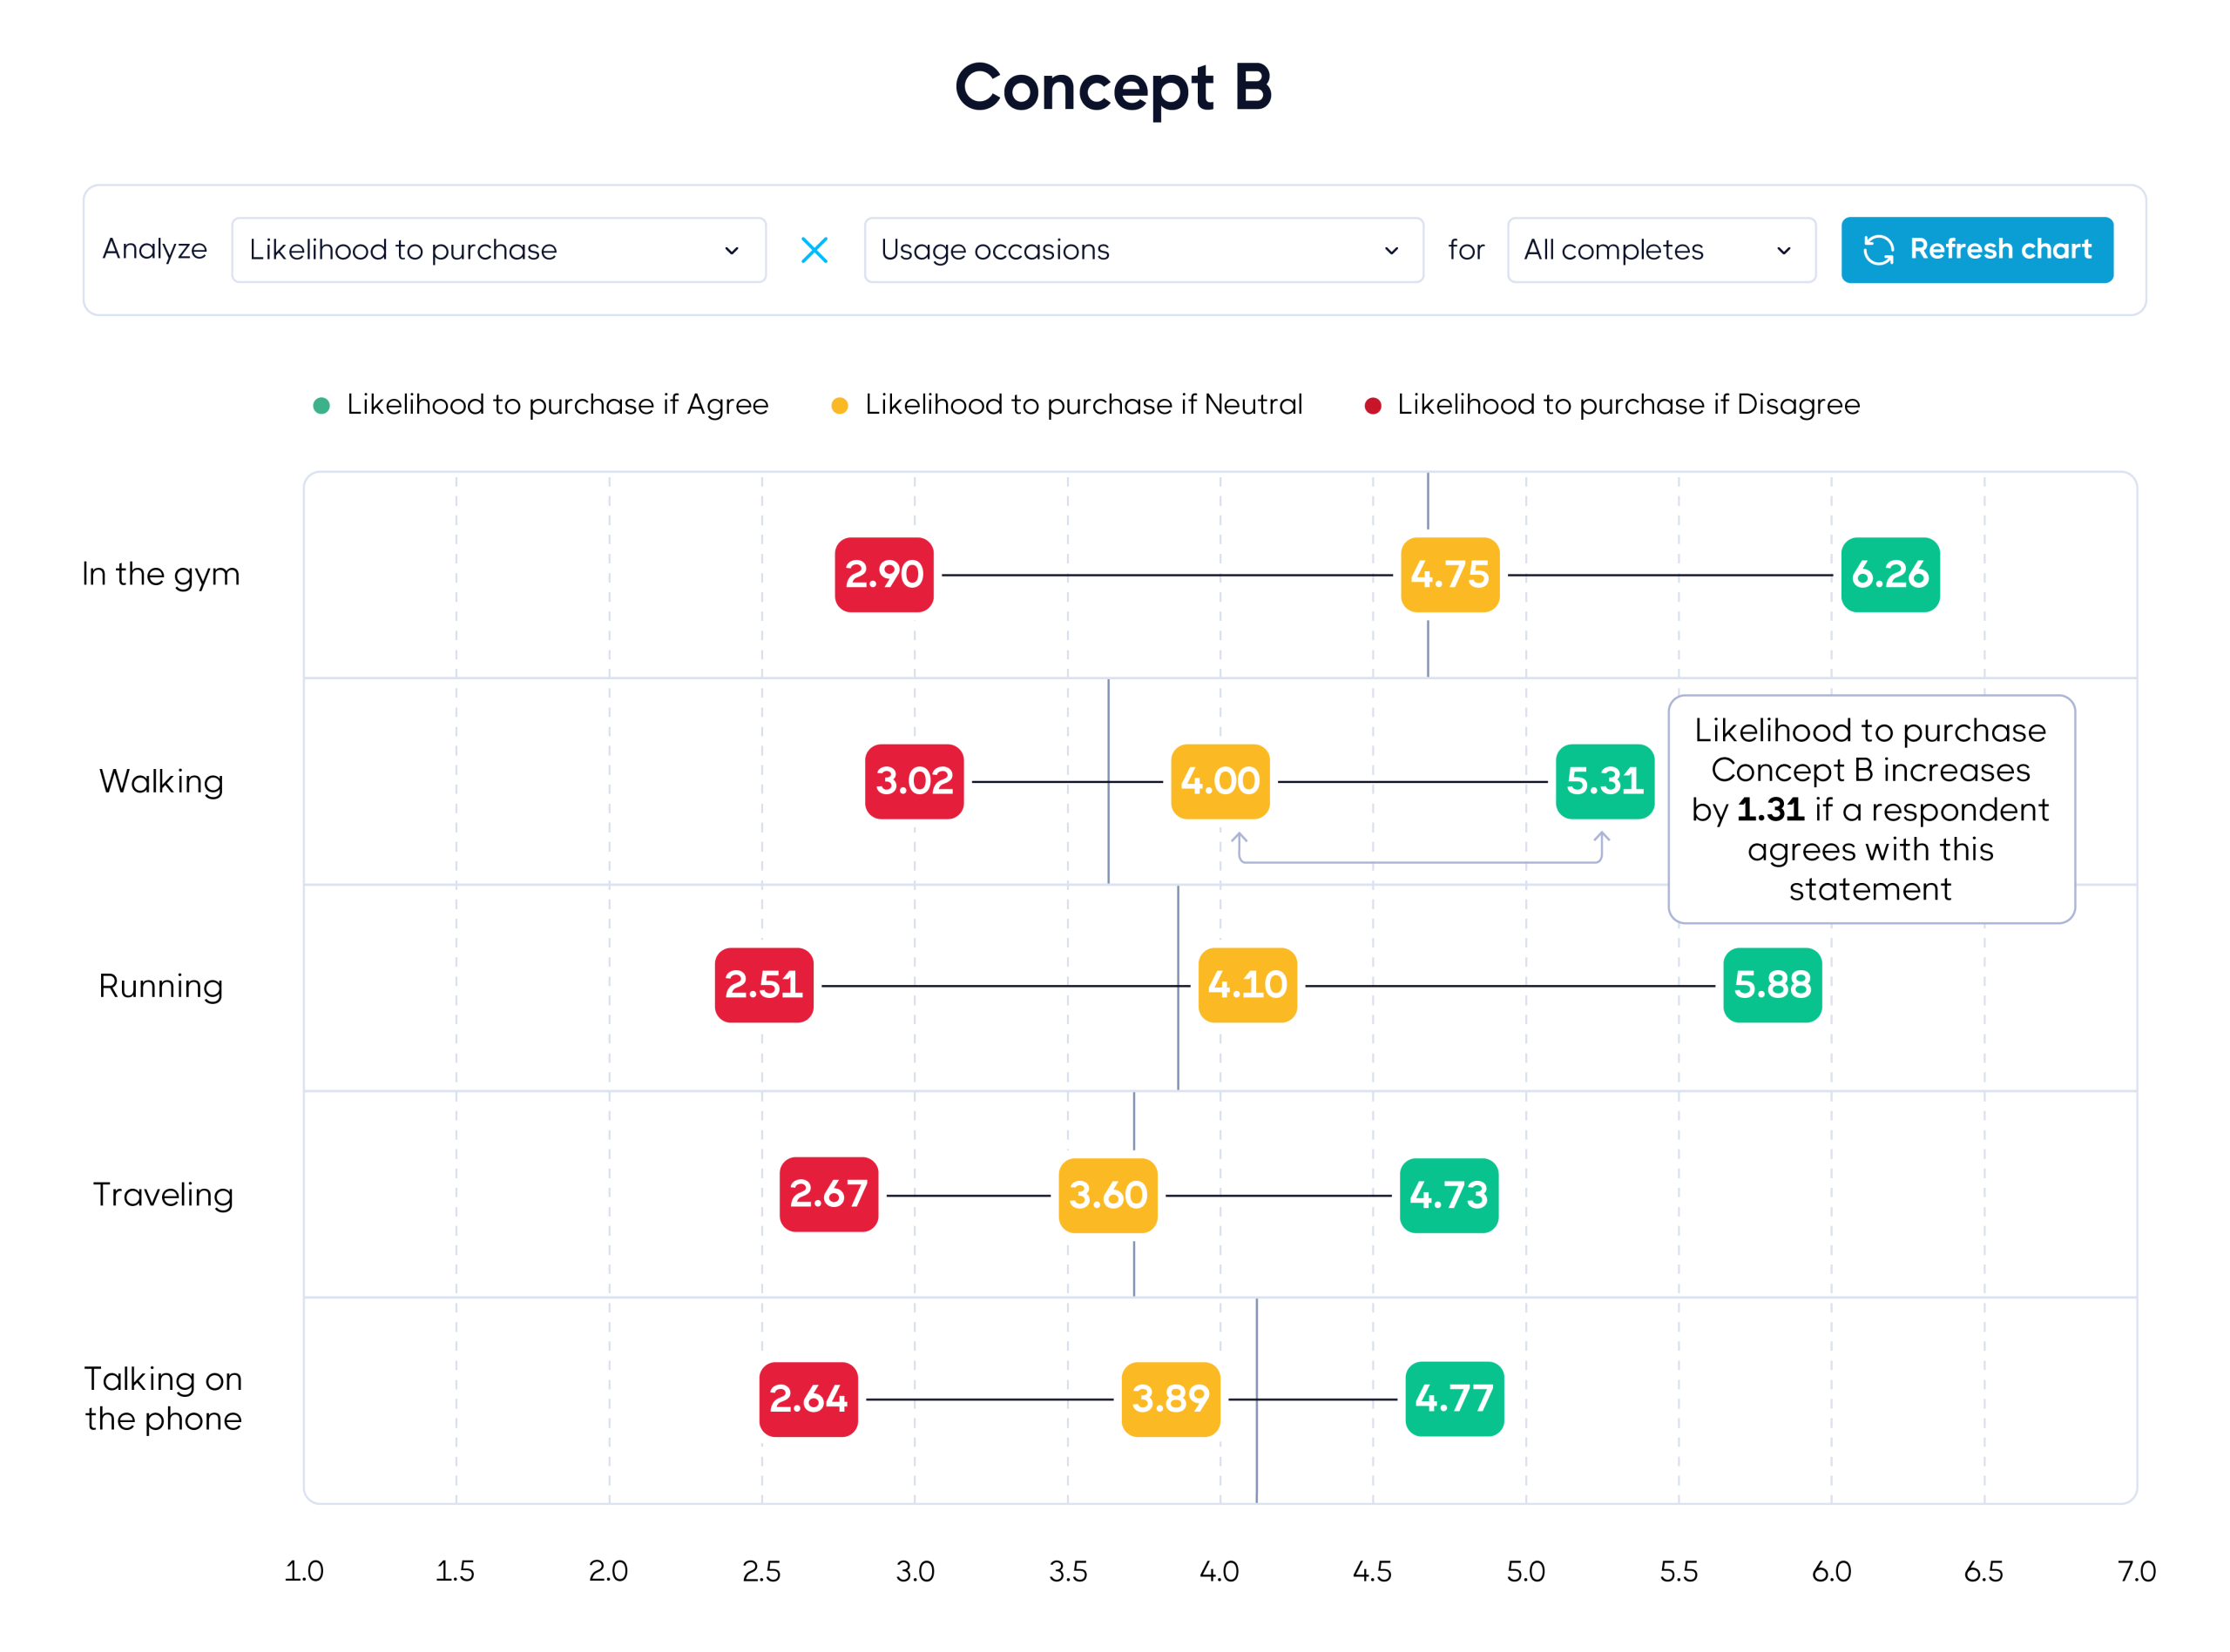
Comparing the two concepts, there are clear differences in the use cases for each style of earphone. Respondents indicated they would use the original style of earphones (Concept A) in more sedentary activities such as “watching TV” and “studying”, whereas the new style of headphones (Concept B) prompted more active use cases such as “going to the gym”.
Even the occasion of “walking” which was top of mind for both versions of earbuds had a significantly stronger impact on the likelihood to purchase Concept B. If consumers agreed they would use Concept B while walking the likelihood of purchase increases by 1.31, whereas for Concept A, there was a mere 0.58 increase.
For Concept B, the use cases of “In the gym” and “running” had the strongest impact on likelihood to purchase, increasing by 1.5 and 1.78 respectively. This suggests that consumers who value the ability to use earphones in more active situations are more likely to purchase the new product.
Use cases with little to no impact on the likelihood of purchasing Concept B, such as “commuting to work” have also proven to be top of mind for respondents, but they may not be influential enough to persuade consumers to purchase a new style of headphones. Perhaps consumers are satisfied with their current headphones for commuting to work and aren’t interested in switching to a new pair solely for this use case.
Using these insights, your marketing team decides to promote the new headphones in more athletic settings, specifically in the gym and on running trails, in order to differentiate the product and encourage customers to try out the new design.
On the product side, the team decides to use these insights to further develop features that suit these scenarios, so they can center future products around what matters most to your customers.
Deloitte x GroupSolver: Understanding Employee Burnout with QuantQual™
Let’s shift gears to a recent example of the QuantQual™ approach in an employee experience study conducted in partnership with Deloitte. GroupSolver worked with Deloitte’s client, an in-house proprietary asset for primary research, to uncover the cause of suspected employee burnout issues.
Using the QuantQual™ approach, the client was able to quickly identify why employees were experiencing burnout and which causes were the most urgent. This allowed the company to find actionable solutions to mitigate top concerns and prevent burnout in the future.
In this study, the client utilized GroupSolver’s AI Open-Ends™ to allow employees to express their burnout concerns and suggestions for improvement in confidence. They paired this with quantitative scales for their employees to indicate the severity of their burnout.
QuantQual™ was one of many GroupSolver visualization tools used to dive deeper into this data.
Let’s look at how QuantQual™ connects the questions “On a scale of 1-10 (10 being very high burnout), how would you rate your current burnout level?" and “Do you have any suggestions for what you would change or add to your current experience relative to burnout?”.
Before we dive into the visualization, it’s important to note that the responses to the AI Open-End™ questions were analyzed as verbatim statements in this graph (as opposed to themes) in order to evaluate specific feedback provided by individual employees.
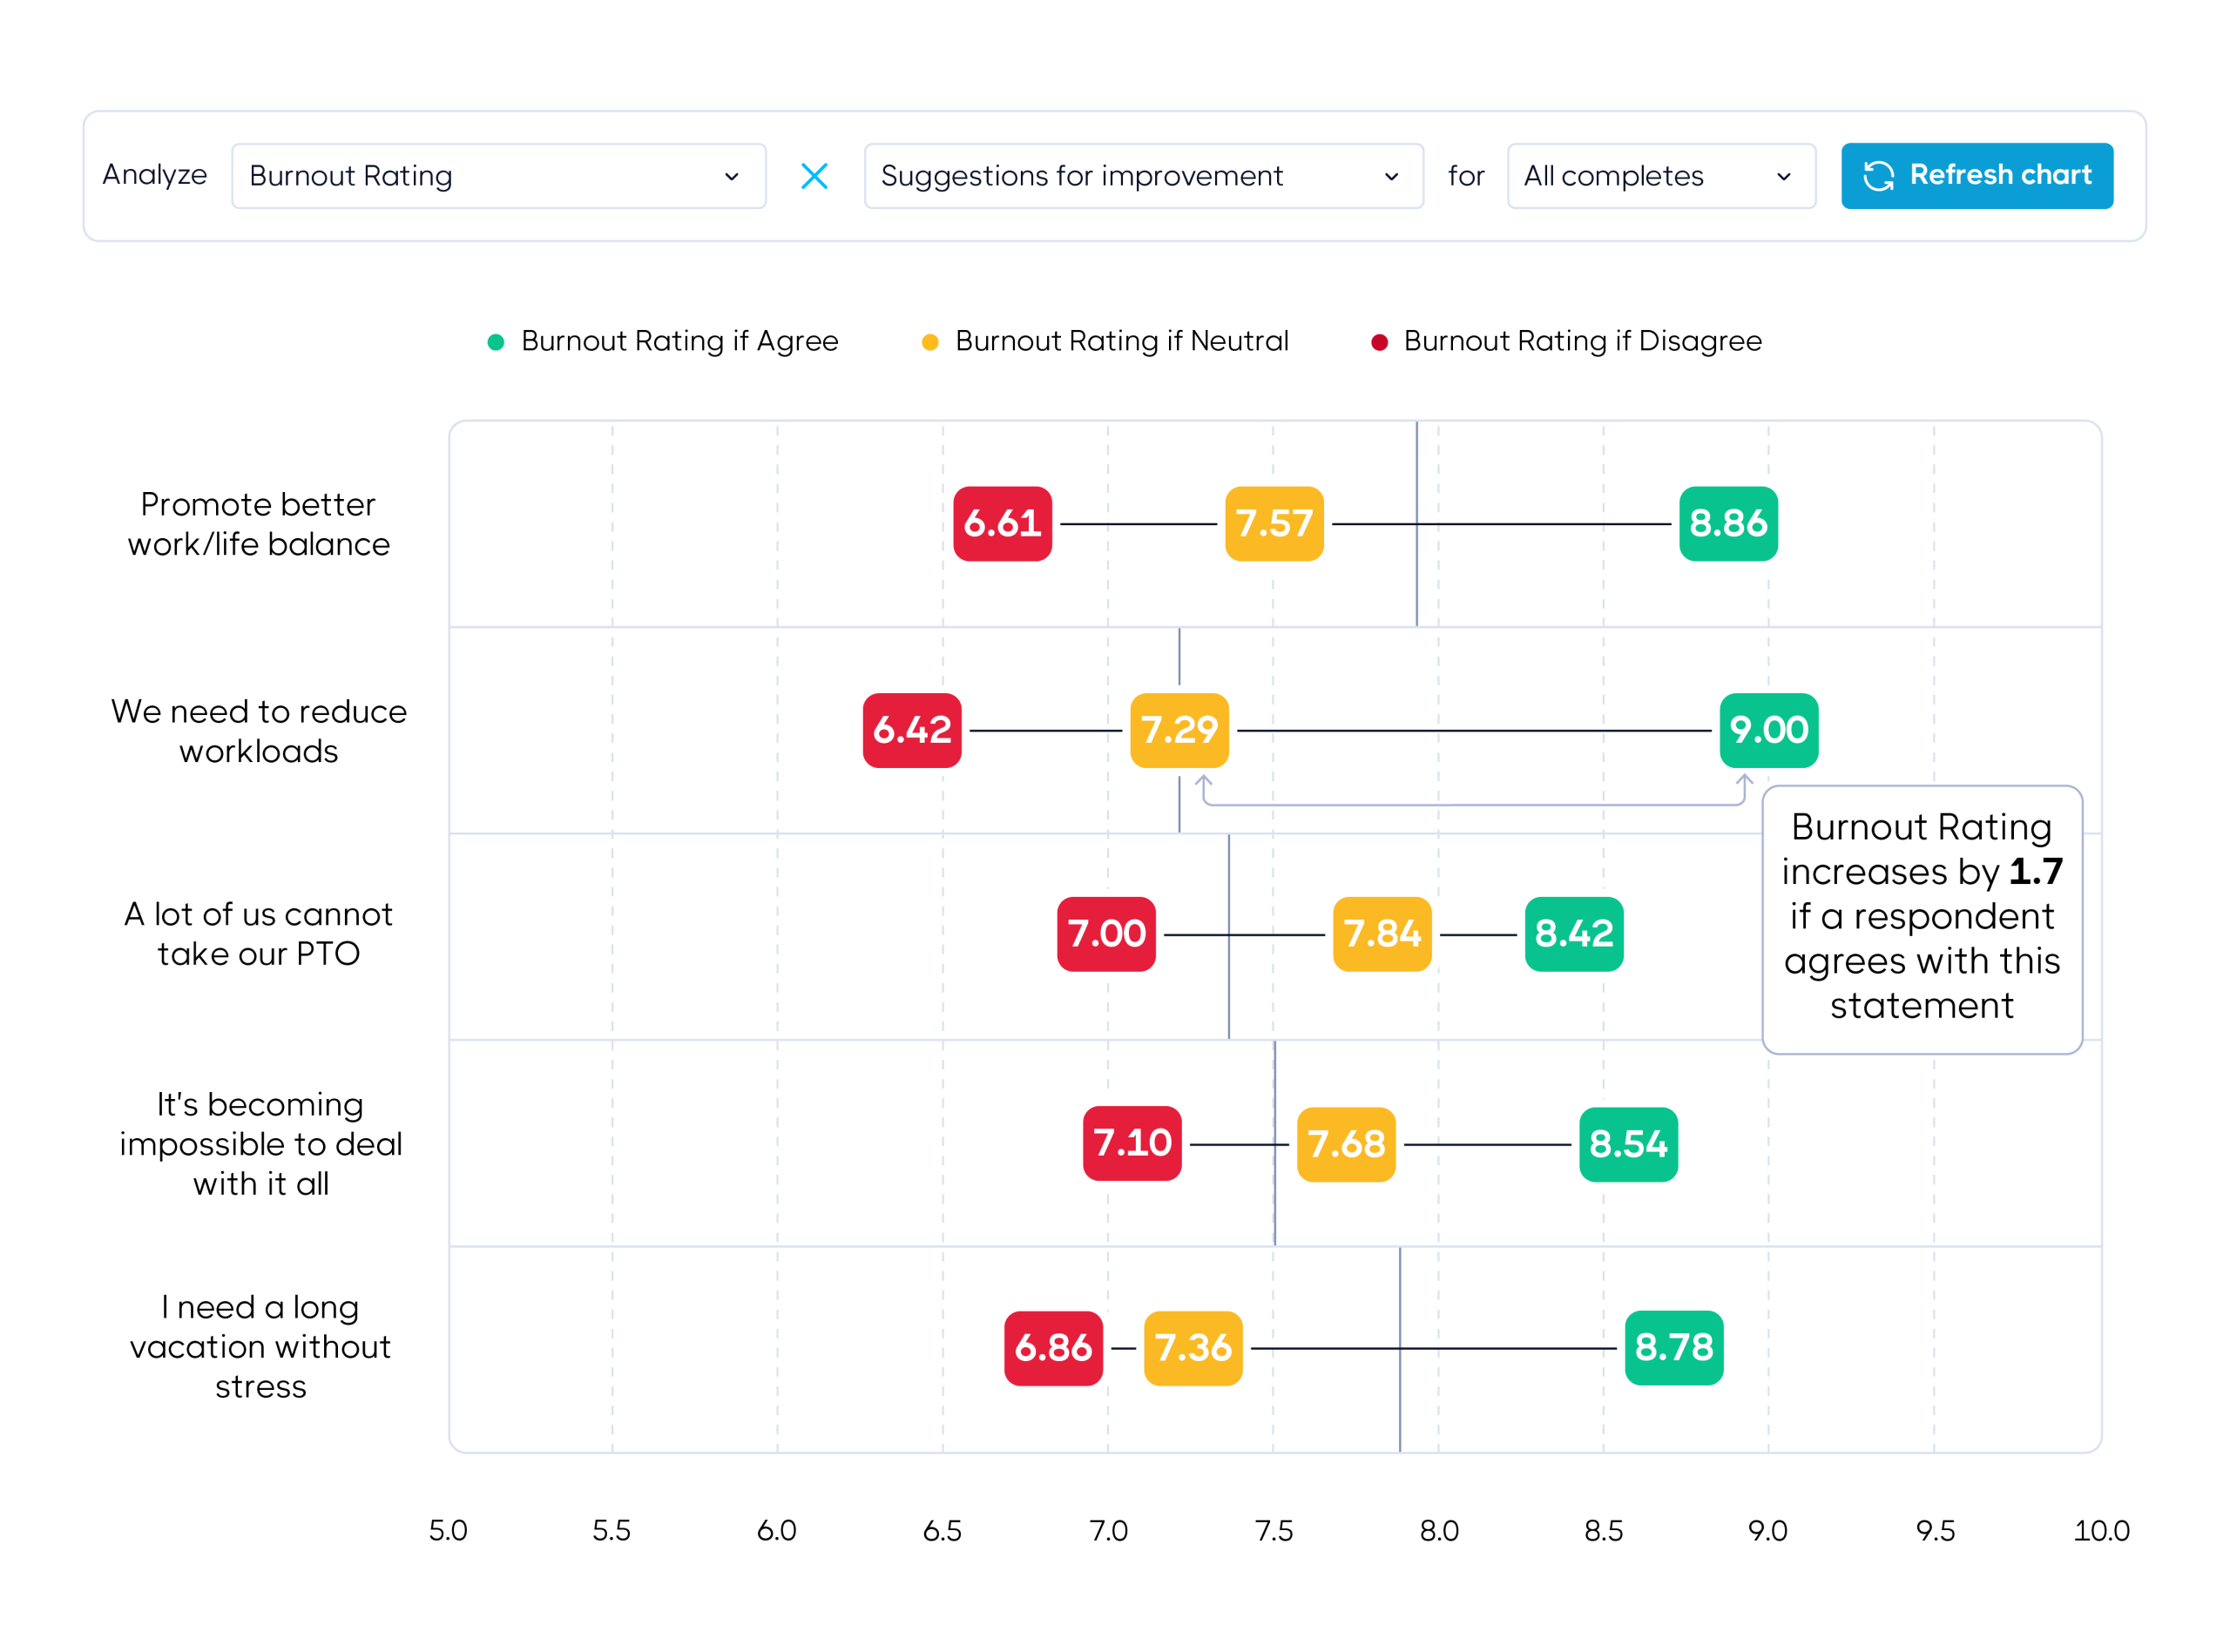
In the chart above we see the 5 suggestions most correlated with higher burnout ratings. The burnout score increases the most (by 1.7) if an employee agrees with the statement “We need to reduce workloads”.
The QuantQual™ visualization makes it easy to identify the most polarizing sentiments, which means that researchers don’t have to sift through thousands of responses to find the most impactful and urgent feedback. Decision-makers can then easily dig deeper into these opinions to uncover patterns and insights they can act on.
For example, analysts in this study found that suggestions with the biggest impact on burnout rating used emotionally charged phrases such as “impossible”, “we need” and “cannot”. Whereas suggestions with little to no impact on burnout rating were significantly less assertive and emotional.
These insights helped the client address the most urgent, emotionally charged burnout issues quickly. Furthermore, they are now proactively monitoring for these phrases and sentiments as warning signs of burnout in the future that they can stay ahead of.
Using QuantQual™ to get more out of your next research project
We’ve walked through a few examples of how QuantQual™ has helped uncover clear business insights in projects studying brand perception, concept testing, and employee feedback. However, this approach promises to help reveal the full story behind almost any research question.
QuantQual™ is a tool for decision-makers to quickly find the most differentiating customer insights and connect them to bottom line. Allowing researchers to truly link the what to the why for the first time in survey research.
If you’re interested in learning more about QuantQual™, we’d love to hear from you. Request a tour of the platform
from our dedicated team or chat with us at sales@groupsolver.com
to learn more.