Unveiling the Streaming Service Universe: Trends, Preferences, and Consumer Insights
In a world saturated with streaming services, the landscape of on-demand entertainment is constantly evolving. To delve deeper into this dynamic shift in the streaming services industry, we conducted a comprehensive study aimed to better understand the story behind our preferences and behaviors on this topic.
We aimed to uncover the drivers of people’s choices in streaming services, exploring both the services they favor and the ones that fall short of expectations. We also looked into pricing preferences and consumer attitudes towards ad-based subscription options prompted by the fact that major companies such as Disney+, HBO Max, and Netflix are adding these tiers into their product portfolio.
Revealing Top Streaming Trends and Decision-Making Factors
Our study found key insights into the streaming preferences of respondents (N= 119). Notably, the top five streaming services that respondents subscribe to are Netflix (67%), Amazon Prime Video (62%), Hulu (53%), Disney+ (41%), and HBO Max (27%). This trend persists as respondents identified their top three favorite services, which include Netflix, Amazon Prime Video, and Hulu.
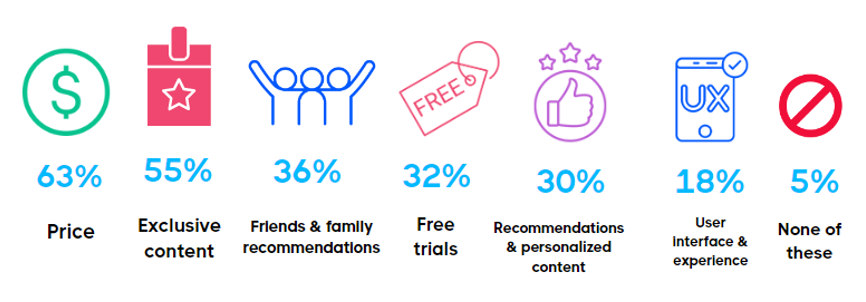
In exploring the factors that significantly impact respondents’ choices when subscribing to a streaming service, our study pinpointed the following key drivers:
Following closely are:
What Matters Most to Consumers in Streaming Services?
Respondents favor several aspects in streaming services, including price, quality content, a diverse selection of shows, content variety, a rich collection of movies, and exclusive content.
Some top answers included:
“An affordable price is what I look for” (87% support)
“Having quality content” (86% support)
“The availability of content” (80% support)
“The shows that are available on it” (78% support)
“If they have what I want to watch” (77% support)
“It has a wide variety of shows” (76% support)
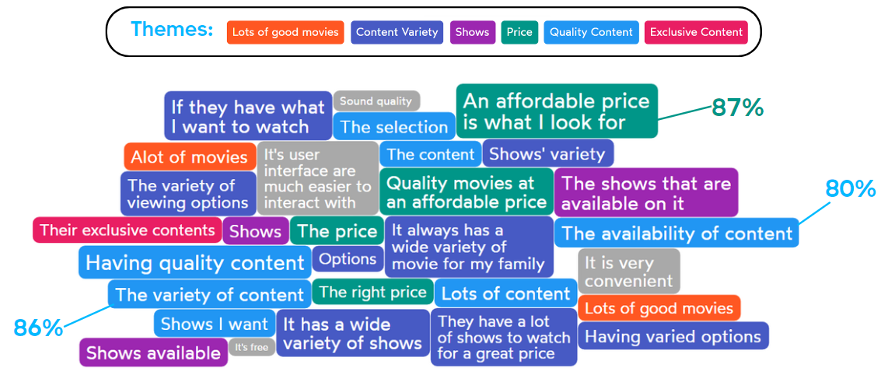 IdeaCloud ™
While many love their services, there are some frustrations with them too. The core reasons behind user dissatisfaction included:
IdeaCloud ™
While many love their services, there are some frustrations with them too. The core reasons behind user dissatisfaction included:
They’re too expensive (64% support)
The quality of the content (56% support)
Way too many commercials (56% support)
Lack of a good selection of live shows despite the service being free (55% support)
The commercials in free services (54% support)
When targeting the right audience, these companies need to keep in mind the delicate balance of providing what makes consumers tick, while not losing sight of their turnoffs.
Streaming Expenses and Preferences
Regarding the financial responsibility for streaming services, a noteworthy 80% of respondents indicated that they independently cover the cost. In contrast, 11% rely on their spouse or partner to cover the expenses, while 4% indicated that another family member (like a parent, sibling, or grandparent) takes care of the subscription fees. These provide a glimpse into the diverse ways in which streaming service expenses are managed within households or by individuals themselves.
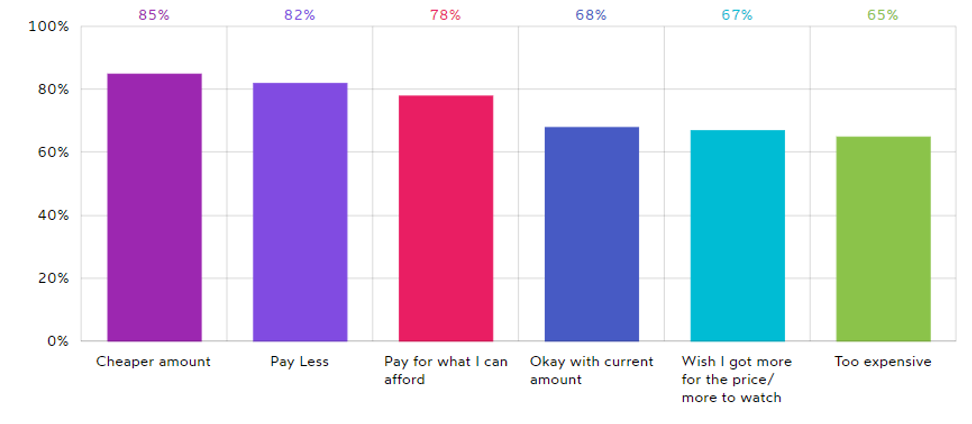
In terms of what people are willing to pay for streaming services, the survey found:
Across the board people wish they didn’t have to pay as much for streaming services with 85% of respondents indicating they wish they paid a cheaper amount and 82% voicing that they wish they paid less. On the affordability front, 78% indicated that they subscribe to streaming services based on their financial capacity, and 68% are content with their current expenditure in this regard. Conversely, 67% of participants expressed a wish for greater content or value in proportion to the amount they pay, while 65% find streaming services to be excessively costly. Furthermore, 77% of respondents emphasized their commitment to not sharing account information with individuals who are not contributing to the service’s cost.
 AI Open-End™
What about Ad Preferences in Streaming Services?
When it comes to the inclusion of advertisements on streaming services, our study highlighted varied preferences among respondents. More than half of respondents, 51%, indicated that they prefer a lower subscription with ads. Followed by 26% of respondents that prefer an ad-free experience, even if it means they pay a higher subscription cost and 23% of respondents voiced that it depends on the frequency and length of the ads.
How does the content available on the streaming services compare or align with expectations?
The types of content that respondents value most in the streaming services they subscribe to are:
Movies 77%
TV series 68%
Documentaries 46%
Crime and mystery series 40%
Live sports and events 29%
Kids and family content 26%
Romantic and drama series 23%
Stand-up comedy specials 22%
Reality shows 22%
Travel and food shows 21%
Animated content 21%
Home improvement and lifestyle shows 19%
The majority of respondents express high satisfaction with the original content produced by streaming platforms, with 86% either somewhat satisfied (46%) or very satisfied (40%). Dissatisfaction levels are notably low, with only 3% combined expressing some degree of dissatisfaction. This suggests a strong overall positive sentiment and contentment among subscribers with the original programming offered by streaming services.
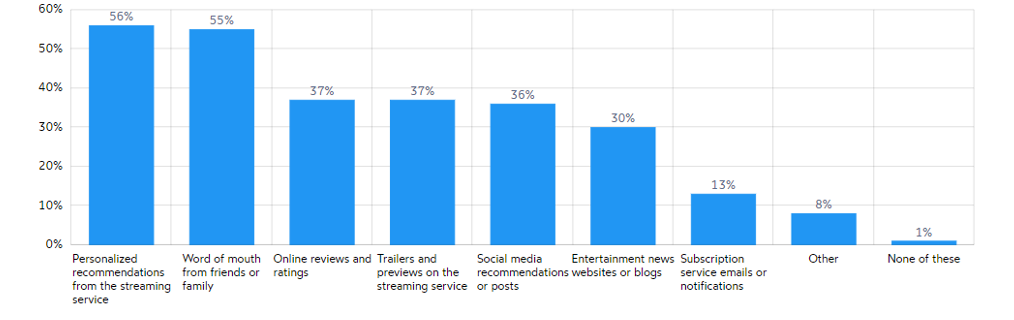
When it comes to discovering new content to watch, users heavily rely on personalized recommendations (56%) and word of mouth from friends or family (55%). They also look at online reviews and ratings (37%), trailers and previews on the streaming service (37%) and social media recommendations or posts. Subscription service emails or notifications have comparatively lower influence (13%), indicating a preference for more interactive and dynamic forms of content discovery.
Subscription Reassessment Patterns
Respondents’ reassessment habits vary, with 22% indicating that they rarely review their subscribed streaming services. Meanwhile, 21% perform monthly checks, 19% opt for a quarterly assessment, 18% conduct an annual review, 12% a semi-annual review, and a mere 4% reassess their subscriptions on a weekly basis. This spectrum of reassessment frequencies underscores the varied and dynamic nature of user engagement with streaming subscriptions.
Top Reasons Users Cancel Streaming Services
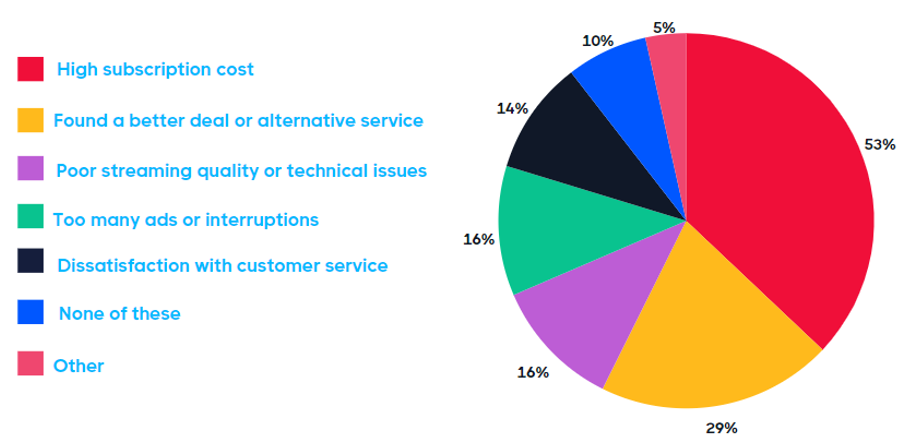
The primary reasons for canceling a streaming service include high subscription costs (53%), followed by a lack of interesting content (35%). A considerable percentage also cancel due to finding a better deal or alternative service (29%). Technical issues and streaming quality impact a smaller but notable portion (16%), while factors such as too many ads, dissatisfaction with customer service, and other reasons contribute to cancellations but to a lesser extent. These insights shed light on the key drivers behind user decisions to discontinue streaming service subscriptions.
So what does this mean? As the streaming universe continues to evolve, these findings serve as a guide shedding light on the intricate web of user expectations and industry trends. And mostly, never losing sight of what your customers what– because just like they can love your content one day, they can move on to the next provider the following day.