How many times have you found yourself having a 10-second panic moment determining how much (if at all) you should tip on your total tab? Whether it is on the fancy-schmancy tablet on your overpriced latte, at a super pricey sit-down dinner with mediocre waitstaff, getting our tires changed with a service upcharge, or getting picked up by an Uber driver at the airport, many of us face an internal debate on what is the correct amount. Will the person providing service be offended if I don’t tip enough? Will my friends think I am cheap?
Maybe it’s just us at GroupSolver overthinking these scenarios, but in an effort to answer our curious questions, we did what we do best: run a pulse check survey to every day Americans facing similar experiences.
Here’s what we uncovered.
We underestimate how much we tip.
On average, people think they spend about $300 per year on tips. Do we believe that? Probably not, but when we asked respondents to estimate that number, that is what we have seen on average. That would mean less than $1 per person per year. It is probably a low-ball estimate, particularly in light of the other answers we got. But maybe it’s because we are underestimating how much we are actually spending on tips.

We always tend to tip.
If there is a tip jar, we put money into it. In our survey, we presented each respondent with a few tipping scenarios: a sit-down restaurant with good, bad, or average service; a pizza takeout; having your tires installed; getting a coffee to go… and in all 13 of our scenarios, we heard that people would tip. Even for bad service.
The most reliable tipping is for a sit-down restaurant service. We pretty much always tip there, and even for “service and meal that didn’t meet your expectations” we tip on average 13% and only about 5% of people told us they would not tip at all. How much do we tip for service and meal that exceeded our expectations? That would be 23%, which in our scenario of a $67 meal translates to a difference of about $6.25. So, if you are wondering next time you are getting average or below average service what to do, consider that your waiter’s expectations of the tip they get does not really make that much difference to them…particularly since they are sharing that tip with other staff. Economically speaking, if one were a waiter, they could try to serve as many tables as quickly as they can to get their volume up, so they get more tipping opportunities. Getting any specific table’s tip up by providing extra care probably doesn’t pay off that much.
Coincidentally, 13% was an average tip respondents would leave for a take-out meal at a restaurant. This was a surprisingly generous amount, considering that in the exercise we had our respondents pick up the meal themselves, and we specifically stated that the restaurant they were picking up their meal from was brand new to them – there was no prior history of good (or bad) service. Perhaps a roughly 13% tip is the unspoken role for the minimum baseline expectations of a tip for any meal, sit down or pickup.
Relatively speaking, we tip the highest percentage for a simple cup of coffee, about 40% on average. Yes, it translates only to one or two dollars, but in those morning rush hour Starbucks lines, the volume of those one-dollar tips must be quite sweet. Interestingly, the ~40% tip is about the same for simple drip coffee or a fancy cappuccino. If one were a mean barista, they could ensure that all breakfast food items were sold out quickly in the morning, because the tip on one cappuccino or a 3-item breakfast with a cappuccino, OJ and a croissant yields about the same tip in terms of dollars.
Now, we can’t complete this blog without getting back to tires, a commonly dreaded experience. For context, in our exercise, respondents purchased a set of 4 tires for the total of $299 and they also spent $69 to have them installed at their house. We asked them how much they would tip assuming they would receive good, bad or average service. On average, respondents would tip about $22, which varied from $19 for below average service and $27 for service that exceeded their expectations. While this translated to only 5% – 7% tip, given the high price tag of the tires, it still translated to a healthy “thank you” to the technician.
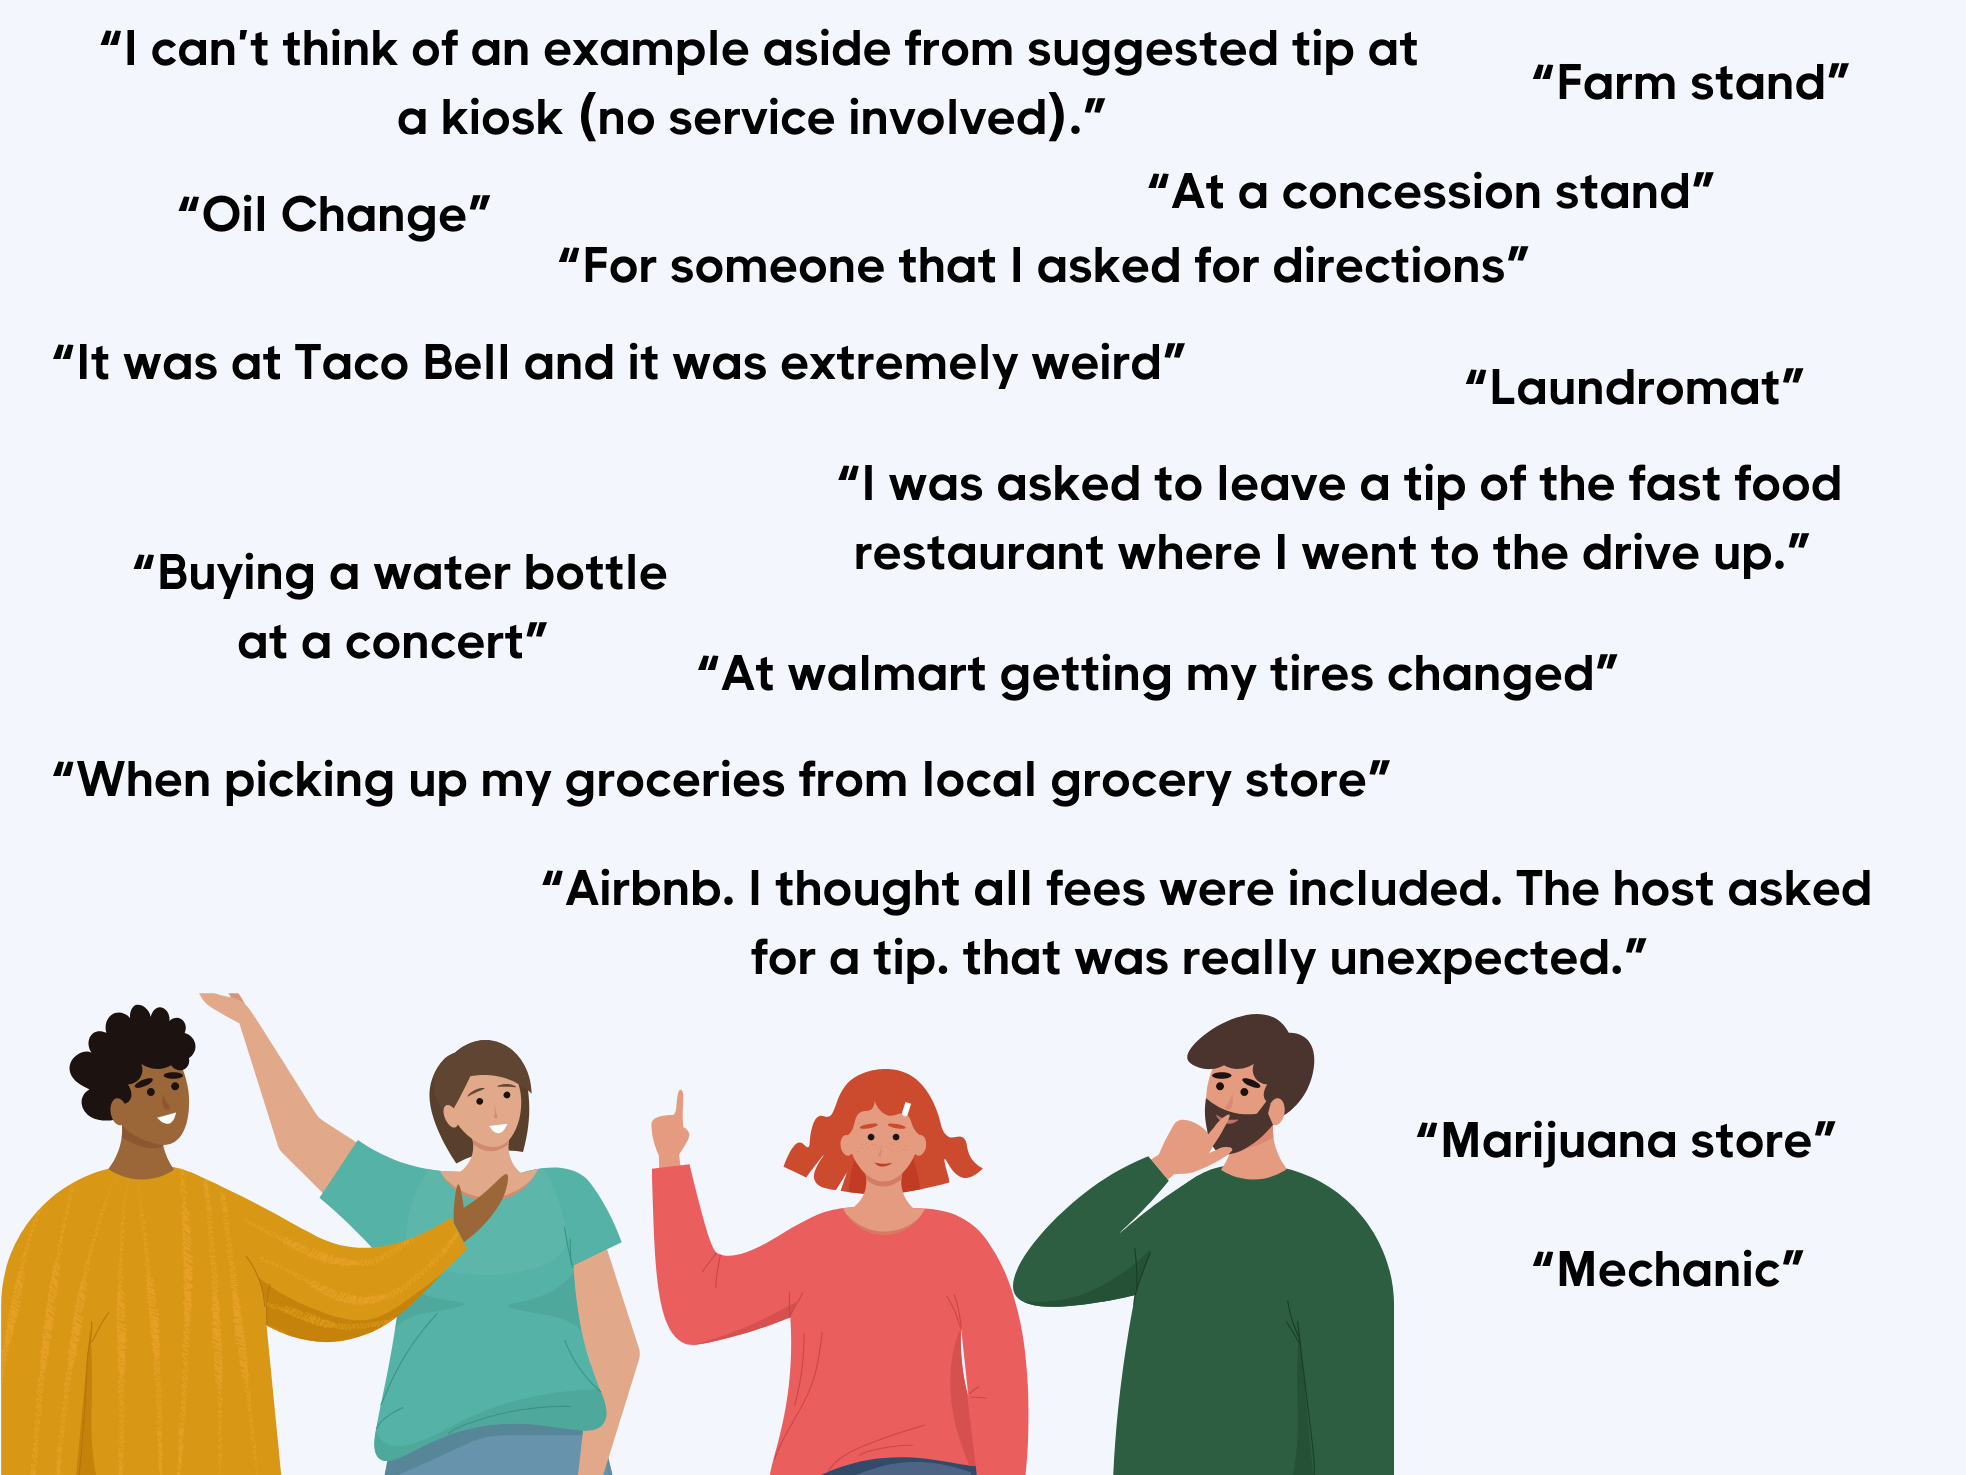
Getting hit with the ‘how much’ when least expected…
The last of our curiosities we were keen on satisfying was to understand where our respondents were met with a request to tip when they least expected. Here are some of our favorites:
So, to tip or not to tip?
While we don’t see one clear rule of thumb on when and how much to tip in our data, our respondents have taught us a few things. Tipping seems to reflect our values and what we should do. We value service, appreciate the minimum wage employees, and want to give what we feel is ‘deserved’. We generally tip when we are asked, but whether it stems out of guilt, obligation, or mere kindness… that is the question we need to ask next.
Our respondents feel that tipping has evolved, and we now tip more. Will the tipping culture continue to change? That is a difficult question to answer looking only at the data. Our economy is changing, and our labor laws may force a change in how tipped employees are compensated. Our gut is telling us that we are less kind to each other. Will that affect how much we leave behind in the jar in appreciation of each other? That may be a topic for another pulse check later in the future.
What else are you curious about? Email us at marketing@groupsolver.com and be featured in our next pulse check report!
~
For a closer look at what we’ve discovered, take a look at our LiveSlides here or email us at info@groupsolver.com for the full data download 👀
Share this article
You might enjoy these too