Reading a generation that says two things at once: inside GroupSolver's Gen Z study
GroupSolver ran its own study of 200+ quality-screened Gen Z shoppers to test a hard research problem: what happens when the topline numbers contradict each other. The answer only surfaced when respondents could write in their own words.
Respondents
200+ screened Gen Z shoppers, US
Study date
May 2026
The contradiction
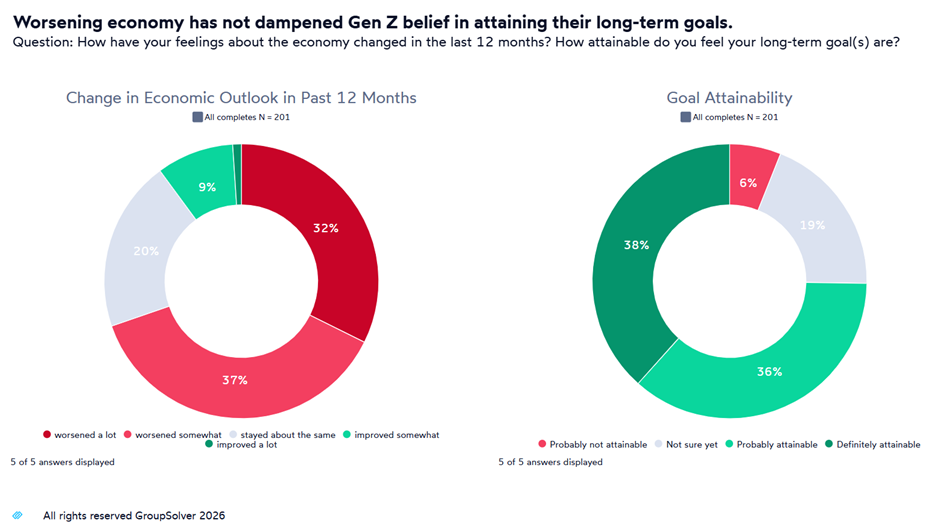
62% rated the economy poor or terrible; 60% were excited about the next 3-5 years
Screening hard before believing a single number
Gen Z is the hardest audience to survey cleanly: fast, mobile, and increasingly sharing panels with bots and AI-generated respondents. Every completed response passed multiple attention and logic traps before a single answer was counted.
Combining scales and open ends in one study
Scaled questions on sentiment, spending behavior, and brand loyalty ran alongside AI Open-End™ questions with no answer options — including the question that produced the study's central finding. QuantQual™ analysis correlated both layers in a single dataset.
Letting Agatha interrogate the findings directly
The full human-validated dataset was loaded into Agatha so the results could be questioned and explored directly, rather than taken on trust from a static report.
The challenge
Gen Z is among the most surveyed and least understood cohorts in consumer research, and the reason is visible the moment you put two of their answers side by side.
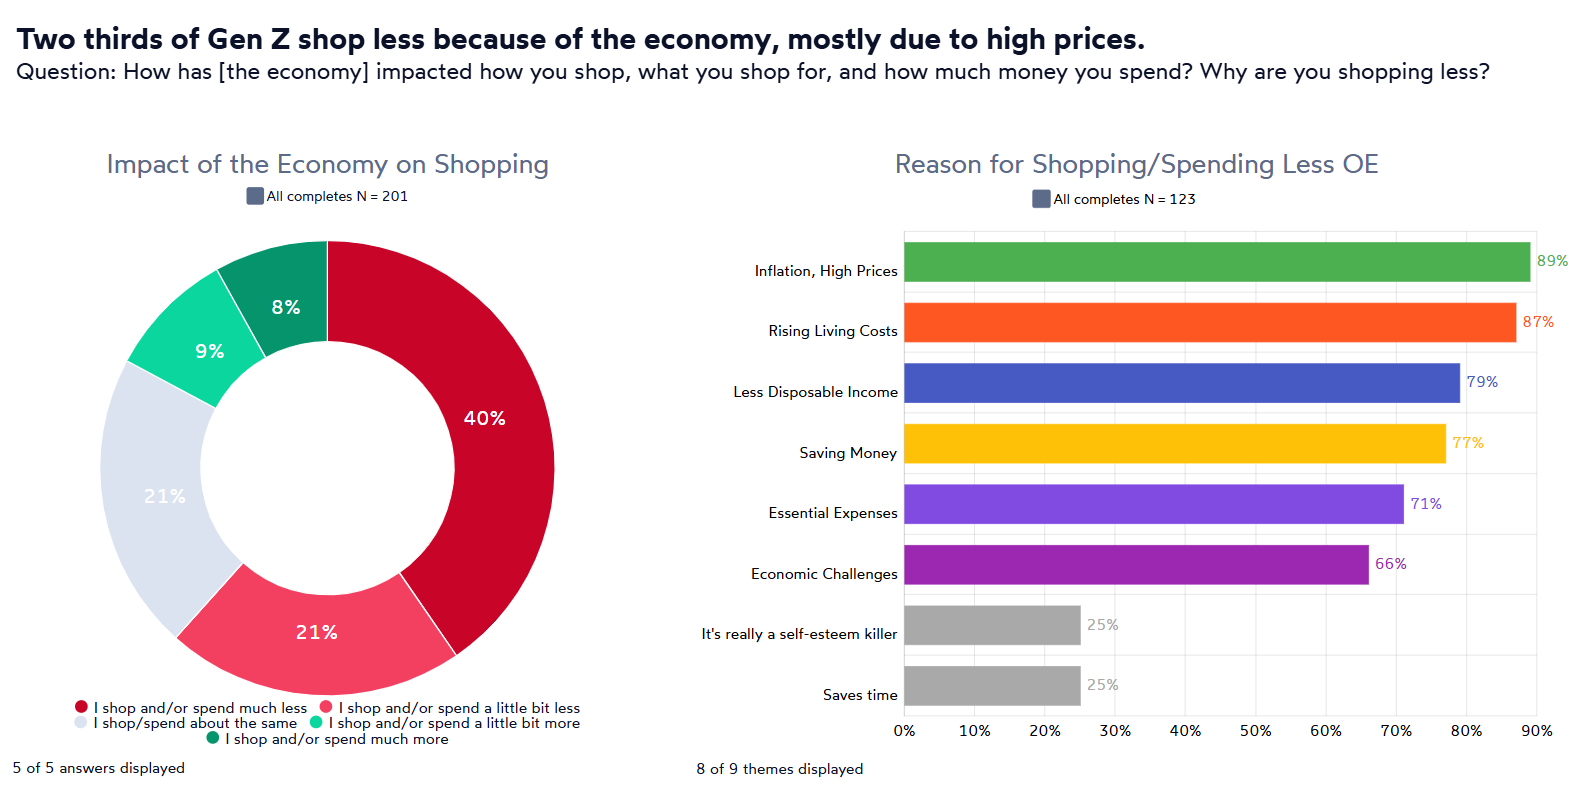
In 2026, 62% rated the economy “poor” or “terrible” for themselves personally. 69% said their feelings about it had worsened over the past year. 61% said they were spending less. By any standard tracker, that is the story: a generation in retreat.
Except the same respondents said something else. 60% were excited about the next three to five years, and roughly three-quarters believed their long-term goals were attainable.
A scale can report both numbers. It cannot explain how both are true at the same time — and a brand that plans against only one of them plans against half a generation. On top of that, Gen Z is the hardest audience to survey cleanly: fast, mobile, and increasingly sharing panels with bots and AI-generated “respondents.”
GroupSolver set out to answer the question on its own platform: could the method surface the why behind the contradiction, not just the what?
The GroupSolver approach
The study fielded in May 2026 with more than 200 US Gen Z shoppers. Every completed response passed multiple attention and logic traps built to catch bots, speeders, and inattentive respondents — the screen came first, before a single number was believed.
The study combined:
Scaled questions on economic sentiment, spending direction, category-level cuts and splurges, and brand loyalty
AI Open-End™ questions with no answer options at all — including the question that produced the study’s central finding
QuantQual™ analysis, correlating quantitative segments with qualitative depth in a single study
HaloGraph™ and IdeaCloud™, grouping open-ended answers by meaning rather than keyword, so “vote them out,” “new leadership,” and “different president” resolved to one theme instead of three
The full human-validated dataset was then loaded into Agatha, GroupSolver’s AI research analyst, so the findings could be interrogated directly rather than taken on trust.
“
Scales tell you how much. Open ends tell you why. The most important finding in this study was one nobody would have thought to put on a list.
GroupSolver Research Team
The results
The squeeze turned out to be specific, not general. Among those cutting back, dining out went first (65%), followed by clothing and fashion (59%) and snacks and treats (55%). What survived were the commitments that are hard to unwind: gym memberships (22%) and rideshares (26%) were least likely to be cut.
The cut list and the splurge list were the same list. Among the minority spending more, the top categories were snacks (66%), fashion (60%), and dining out (49%) — near-identical to what everyone else was cutting. These are the affordable joys: the levers Gen Z pulls in both directions to feel control over a budget that otherwise feels out of their hands. For brands, that makes them the most volatile line in the Gen Z budget — first to contract, first to rebound.
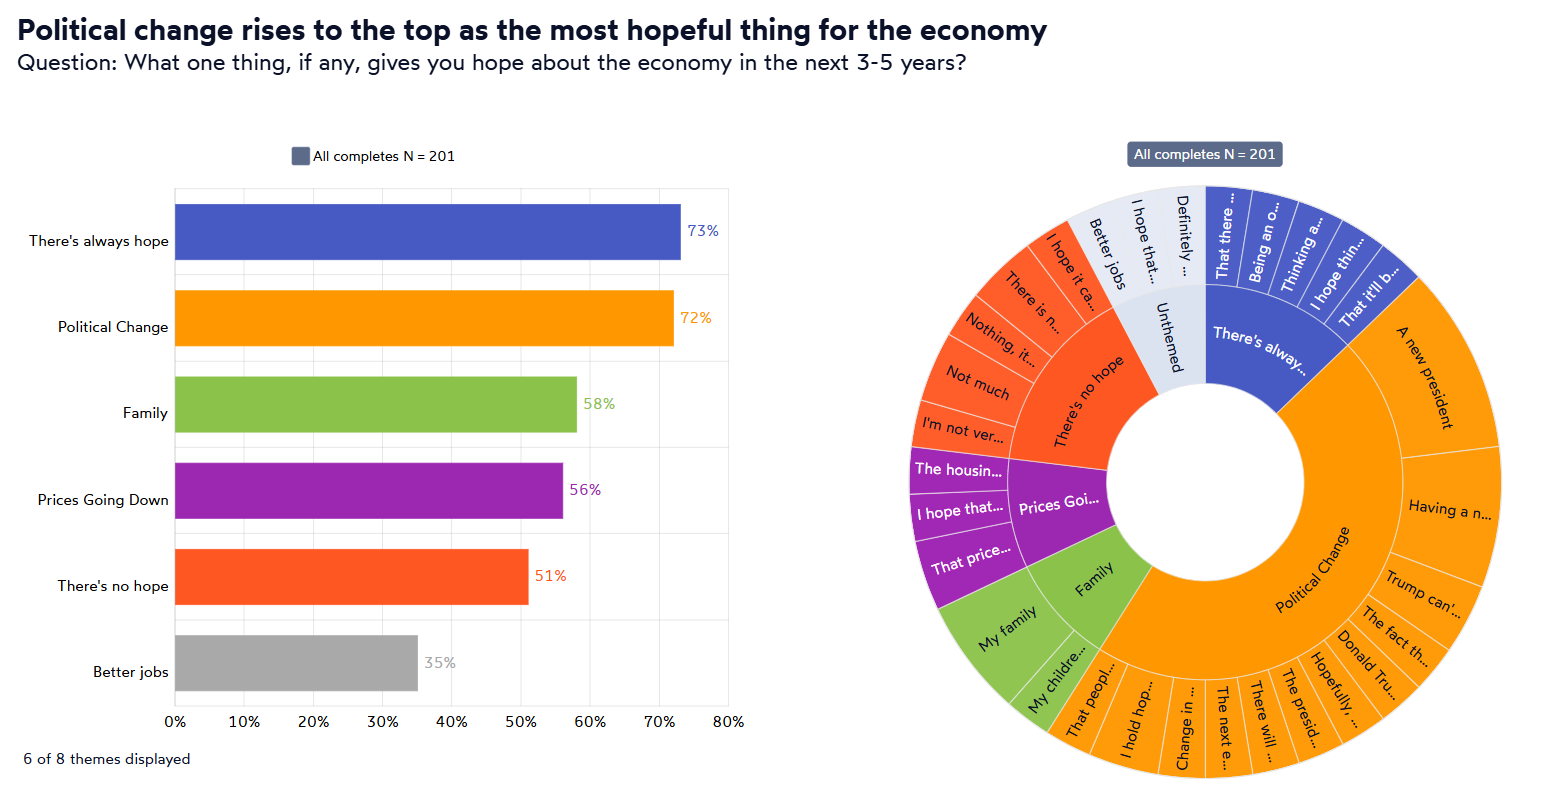
The optimism had a source no answer grid would have found. Asked in an open text box what made them hopeful about the economy, roughly one in three named political change directly. Grouped semantically, the theme approached half of all hopeful responses — the dominant answer by a wide margin. No personal financial factor came close. Gen Z frames its economic future as tied to forces larger than itself, and nobody had thought to pre-write that option.
Loyalty proved deeper than the pessimism suggested. 58% reported having a go-to favorite brand, and of those, roughly 95% said they trust it.
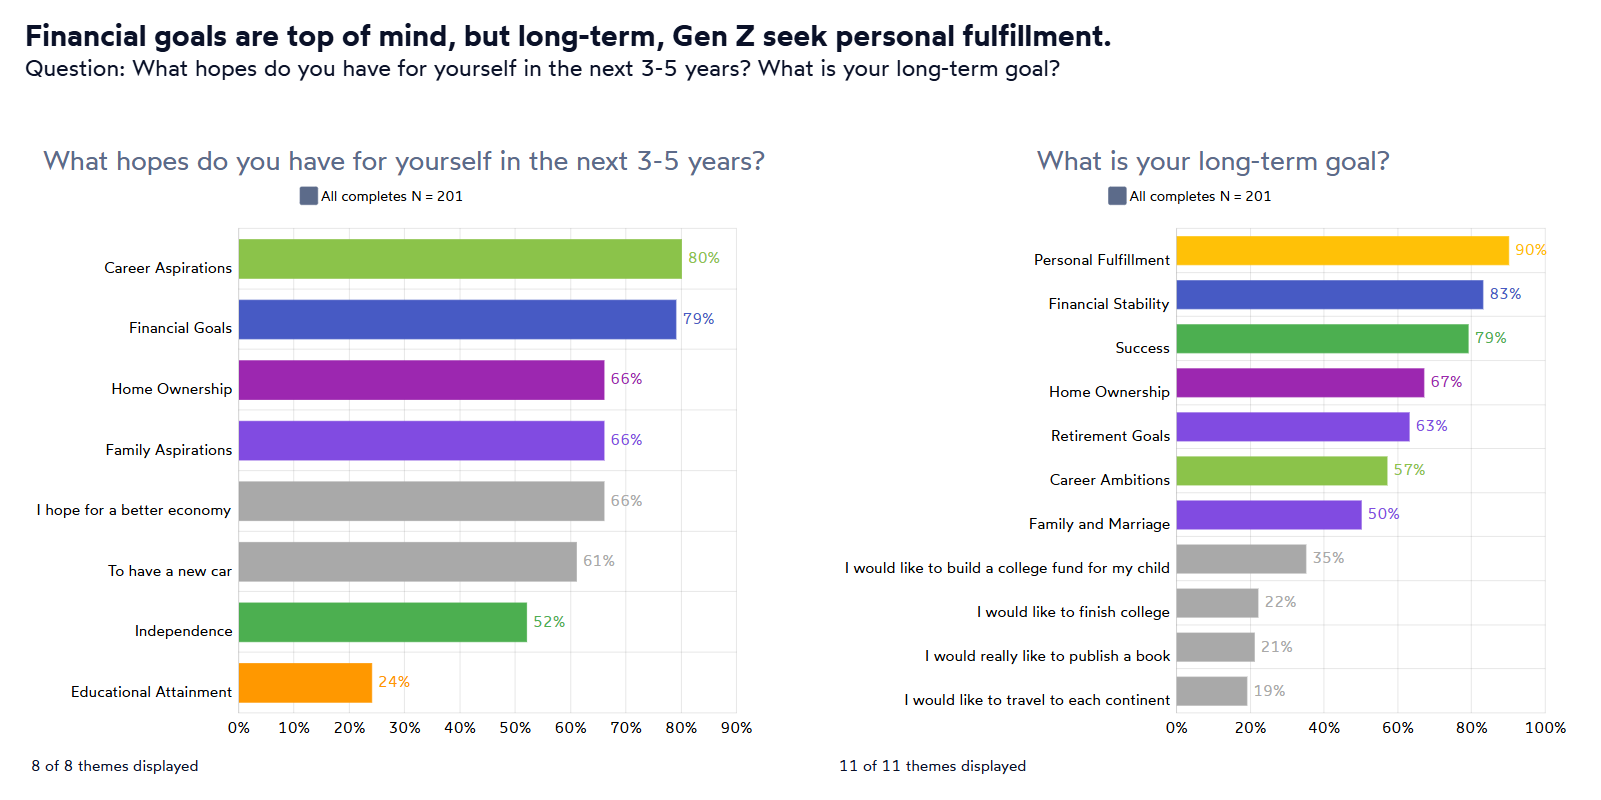
The contradiction resolved once the method allowed it to. Gen Z is squeezed today and betting on later, and the two answers belong to different time horizons — near-term goals are defensive (career, financial stability, home ownership), while fulfilment and happiness are deferred to the long term. That structure was invisible to any single scale.
Want to ask your own questions of this Gen Z dataset?
The most important finding was one nobody would have pre-written. Political change as the primary driver of Gen Z economic optimism only surfaced because respondents had a blank text box. A pre-coded list of answer options would have buried it entirely.
Spending cuts and splurges are two sides of the same category. Dining out, fashion, and snacks are the first to go and the first to come back. Brands in these categories are dealing with genuine volatility, not permanent retreat.
Pessimism and optimism operate on different time horizons. Gen Z isn’t contradicting itself. It’s answering two different questions about two different periods of its life. Research that conflates them produces a distorted picture of both.
Data quality on Gen Z is not optional. Without rigorous screening upfront, the findings would have reflected bots, speeders, and panel recyclers — not the generation. The method and the insight are inseparable.
About the study
This study was designed and fielded by GroupSolver on its own platform as a demonstration of AI Open-End™, QuantQual™, and Agatha capabilities. The full dataset is available to explore via the live demo.