4 data quality measures every survey needs in 2026: Lessons from 12 months in the trenches
·12 min read
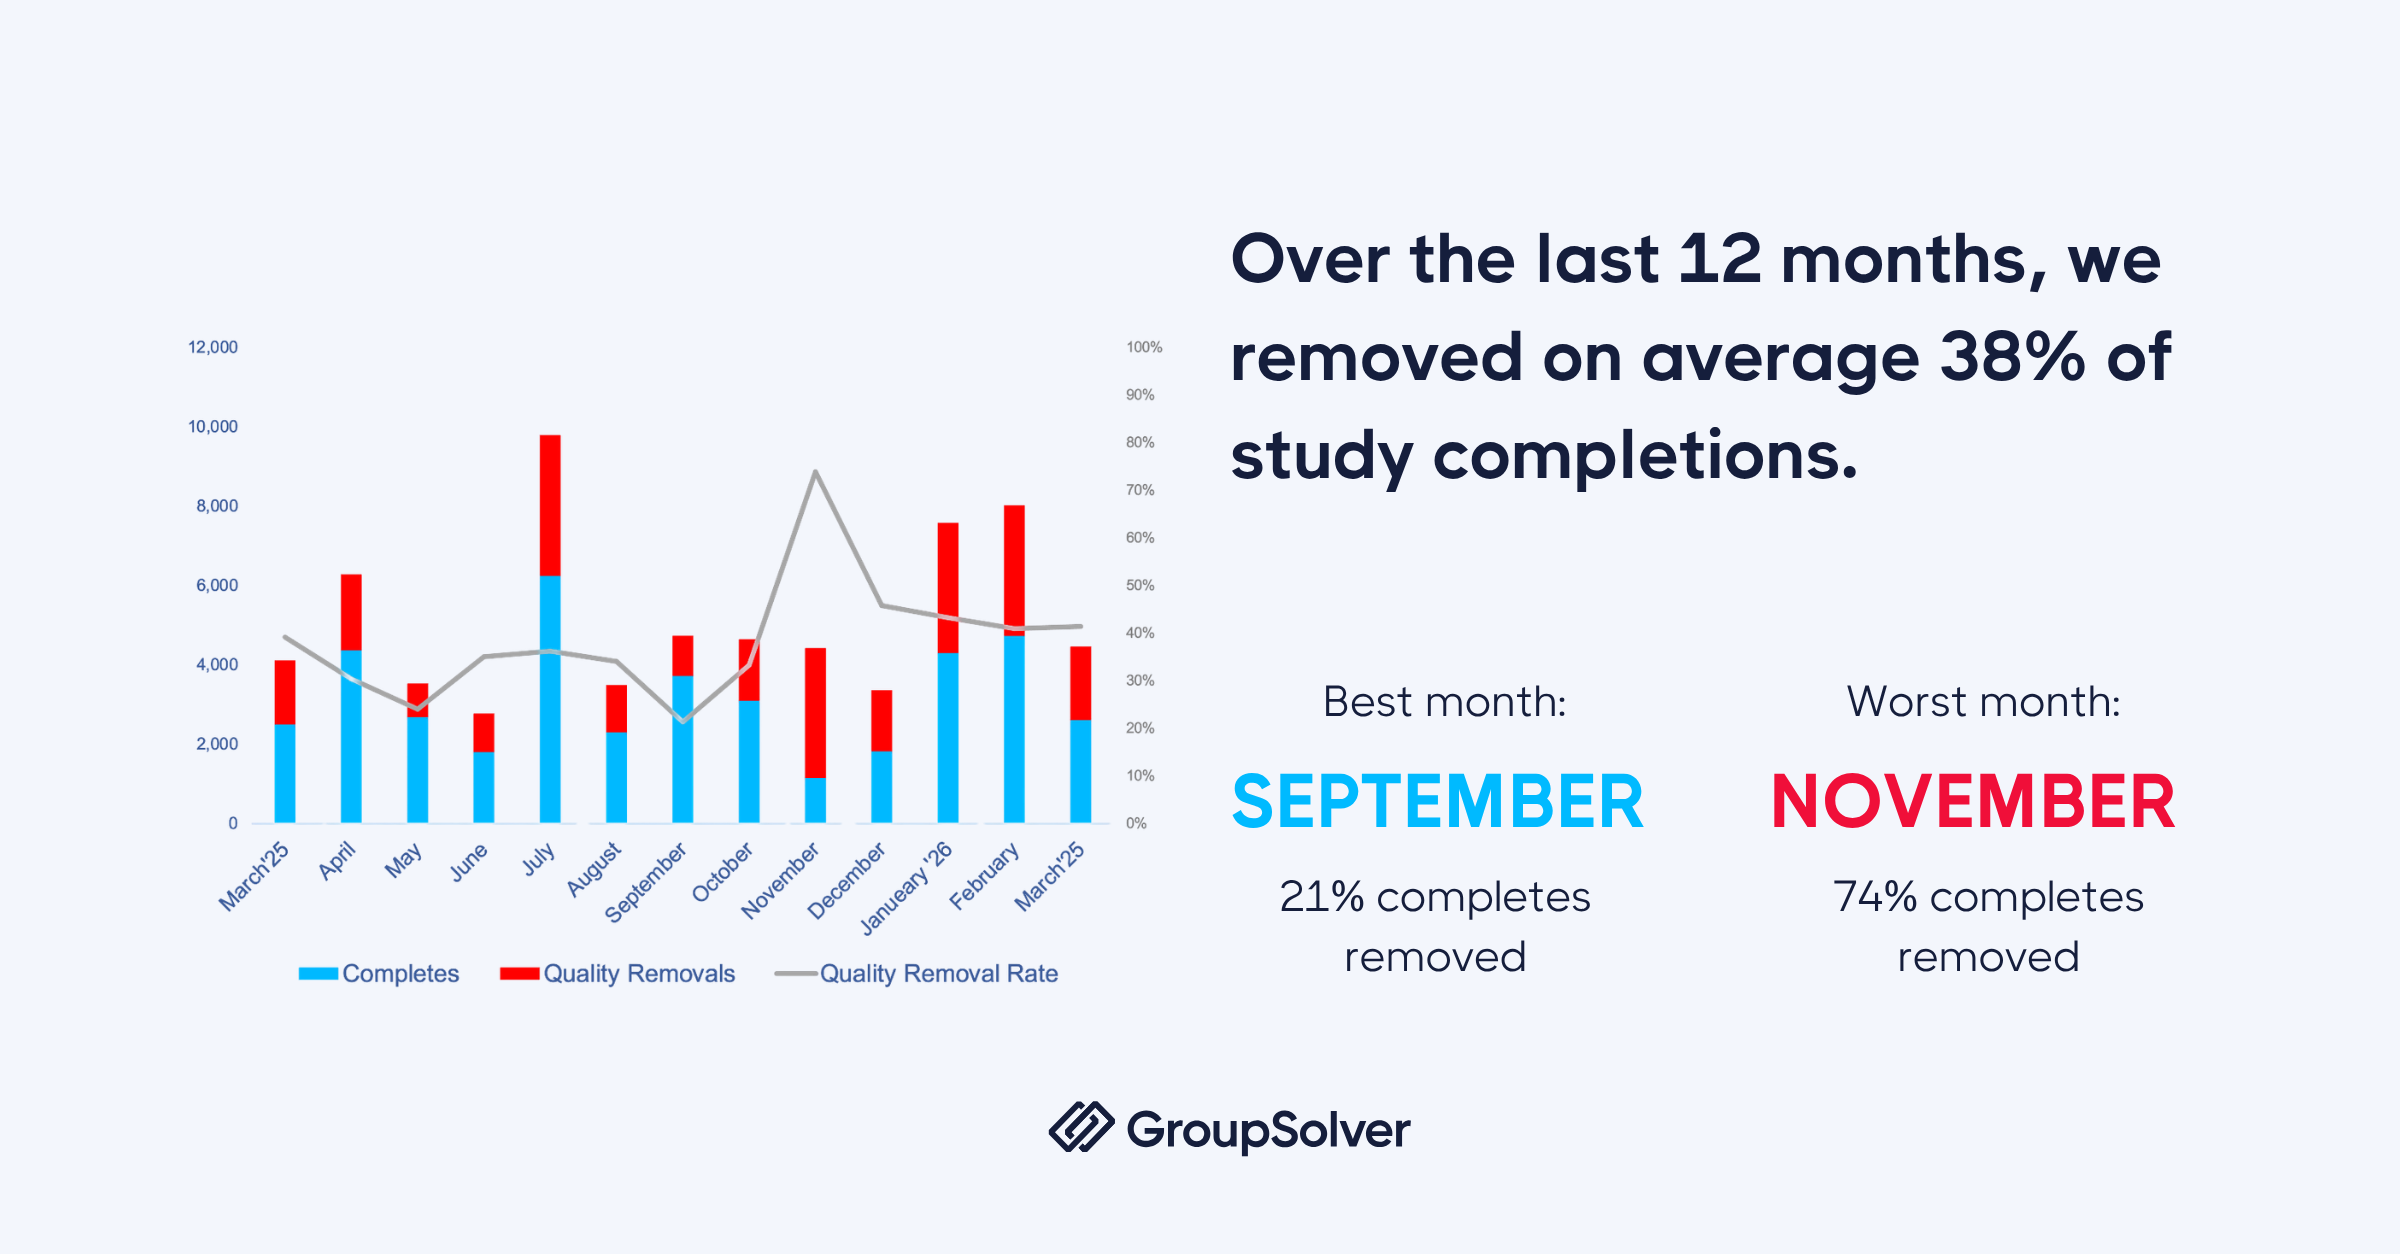
Survey data quality has become the single most important factor separating useful research from misleading research. Over the past 12 months, GroupSolver removed an average of 38% of survey completions for fraud or inattentiveness, and over the last six months, that rate climbed to 45%. The four measures below come straight from a year of fighting bots, click farms, and AI-assisted respondents in live surveys, and they apply whether you run quantitative studies in-house or rely on outside vendors.
Short on time? Jump straight to the specific section:
Why survey data quality hit a breaking point in 2026
This all started with a single B2B study. The target audience was US educators, higher education administrators, and professors. Standard 21-minute medium-length survey, recruited through a mix of programmatic and custom panels. We expected normal screen-out rates. We got something very different.
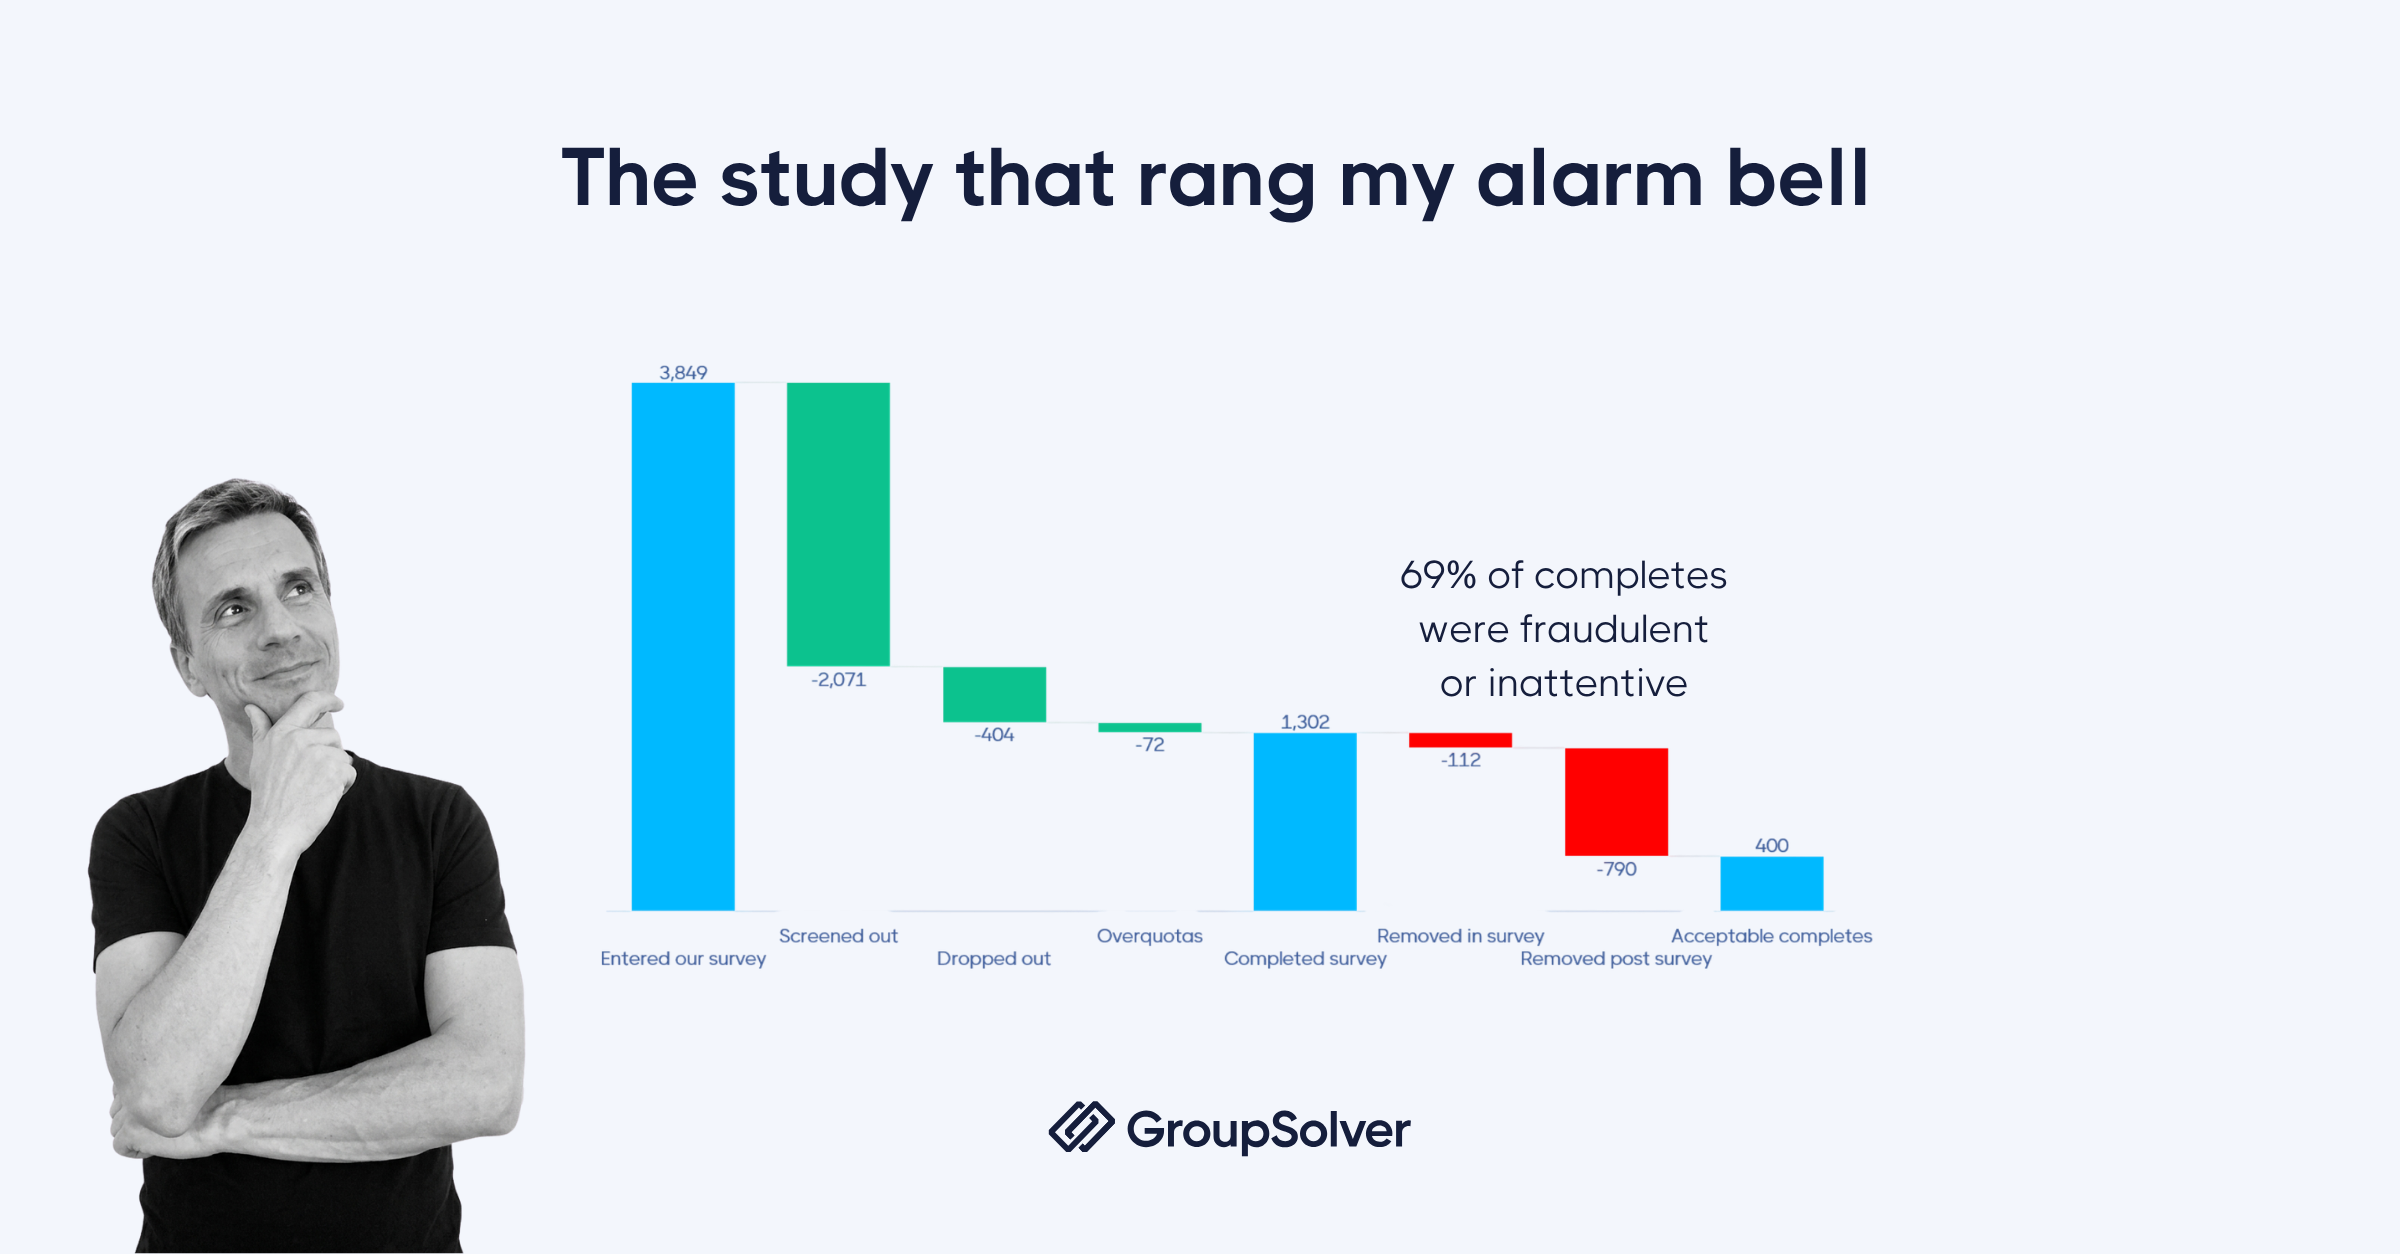
Of 3,849 entries: 2,071 were screened out, 404 dropped out, 72 hit overquotas, and 1,302 completed the survey. Reasonable so far. Then the quality checks ran. 112 were removed in the survey. Another 790 were removed post-survey. Final count: 400 acceptable completes = 69% of the people who reached the end of the survey were either fraudulent or inattentive. That study rang the alarm bell.
Once we started tracking every survey we ran, the pattern held. Across 12 months, our average quality removal rate sat at 38%. Over the last six, it climbed to 45%. The best month: 21% removed. The worst: 74% — meaning three out of four “completes” were unusable. Sample quality is neither good nor getting better.
This isn’t a panel problem or a recruitment problem. It’s a market-wide condition. AI tools made it cheap to fake responses. Click farms got more sophisticated. Panel economics still reward volume over verified quality. Every researcher now operates in a contaminated environment, whether they realize it or not.
What survey data quality actually means in 2026
Survey data quality is the degree to which the responses in your dataset come from real, attentive humans who match your target audience and answered your questions truthfully. That’s a deceptively simple definition, because each piece of it has gotten harder to verify.
Three threats now drive most of the loss:
AI-assisted respondents using LLMs to auto-fill open-ended fields and pass basic logic checks
Bot networks and click farms that can defeat first-generation attention checks
Disengaged human panelists rushing through surveys for incentives without reading the questions
Old metrics like completion rate or speeder flags catch only a fraction of bad data. Real survey quality control today means designing surveys assuming the enemy is technologically capable, well-funded, and learning your patterns the same way you’re trying to learn theirs. (For a deeper look at the AI-specific side, see our guide to detecting AI-generated survey responses
.)
Measure 1: Design surveys for humans, engineer them against AI
The first defense is structural: a survey that’s worth completing for real humans, and structurally hostile to bots and inattentive respondents.
Three minimums apply to every study we run:
Two or more attention checks per survey, placed strategically throughout, not bunched at the start
Three or more open-ended questions, both for richer insight and as a check on language patterns
One or more logic checks with questions that test whether earlier answers stay consistent later
But the bigger shift isn’t quantity, it’s the design of the attention check itself. Two years ago, “What is six plus three?” was a defensible trap question. Today, every LLM solves that in milliseconds, and so do the bots wrapping LLMs to fill out surveys.
Modern survey trap questions need to exploit AI’s blind spots while staying answerable for real humans. Our favorite category: questions that expose the LLM’s tendency to provide an answer when a human would say “I don’t know.” 💡 Example: “Without looking it up, what is the ZIP code of Greenhorn, Oregon?” — followed by five plausible-looking ZIP codes plus an “I don’t know” option. Greenhorn has a population of zero. No human anywhere should know the ZIP code. Real respondents pick “I don’t know.” LLMs, trained to produce confident answers, almost always pick the wrong number.
Three principles for designing trap questions in 2026:
Test attention checks monthly against current LLMs — what worked six months ago may not work now
Randomize which question appears, drawing from a pool, so fraudsters can’t memorize the path
Combine with open-ended questions to test for answer consistency across formats
The same checks that catch AI bots also catch human fraud and inattentive respondents; the cognitive economics work the same way for all of them.
Measure 2: Terminate bad respondents in-survey, but never immediately
This is the counter-intuitive one. When you catch a bad respondent, the instinct is to terminate immediately and move on. Don’t.
Immediate termination is a teaching signal. The fraudster (or the bot operator) learns exactly which question caught them. They retry the survey through a different IP, fix that one answer, and complete successfully. You just trained your enemy.
Better approach: let bad respondents finish the survey, then quality-terminate at the end. Three benefits stack up:
They never know which question flagged them, so they can’t optimize for next time
You learn their patterns across the whole survey, not just one trigger point
You waste their time and tokens, which raises their cost per attempt
We’ve executed more than 25,000 quality terminations through this approach since March 2025. The panel reconciliation rate, meaning panels accepting our termination evidence and not paying the respondent, has been 100%. We’ve received exactly one complaint from a terminated respondent, and when we explained the failure, they walked away without demanding payment.
The economics matter. Survey fraud is a business. The longer it takes a fraudster to crack your survey, the more time real respondents have to fill the quotas first. You’re not just protecting your dataset, you’re tilting the odds back toward genuine humans every time you waste a fraudster’s time.
Measure 3: Audit your panel suppliers monthly and vote with your dollars
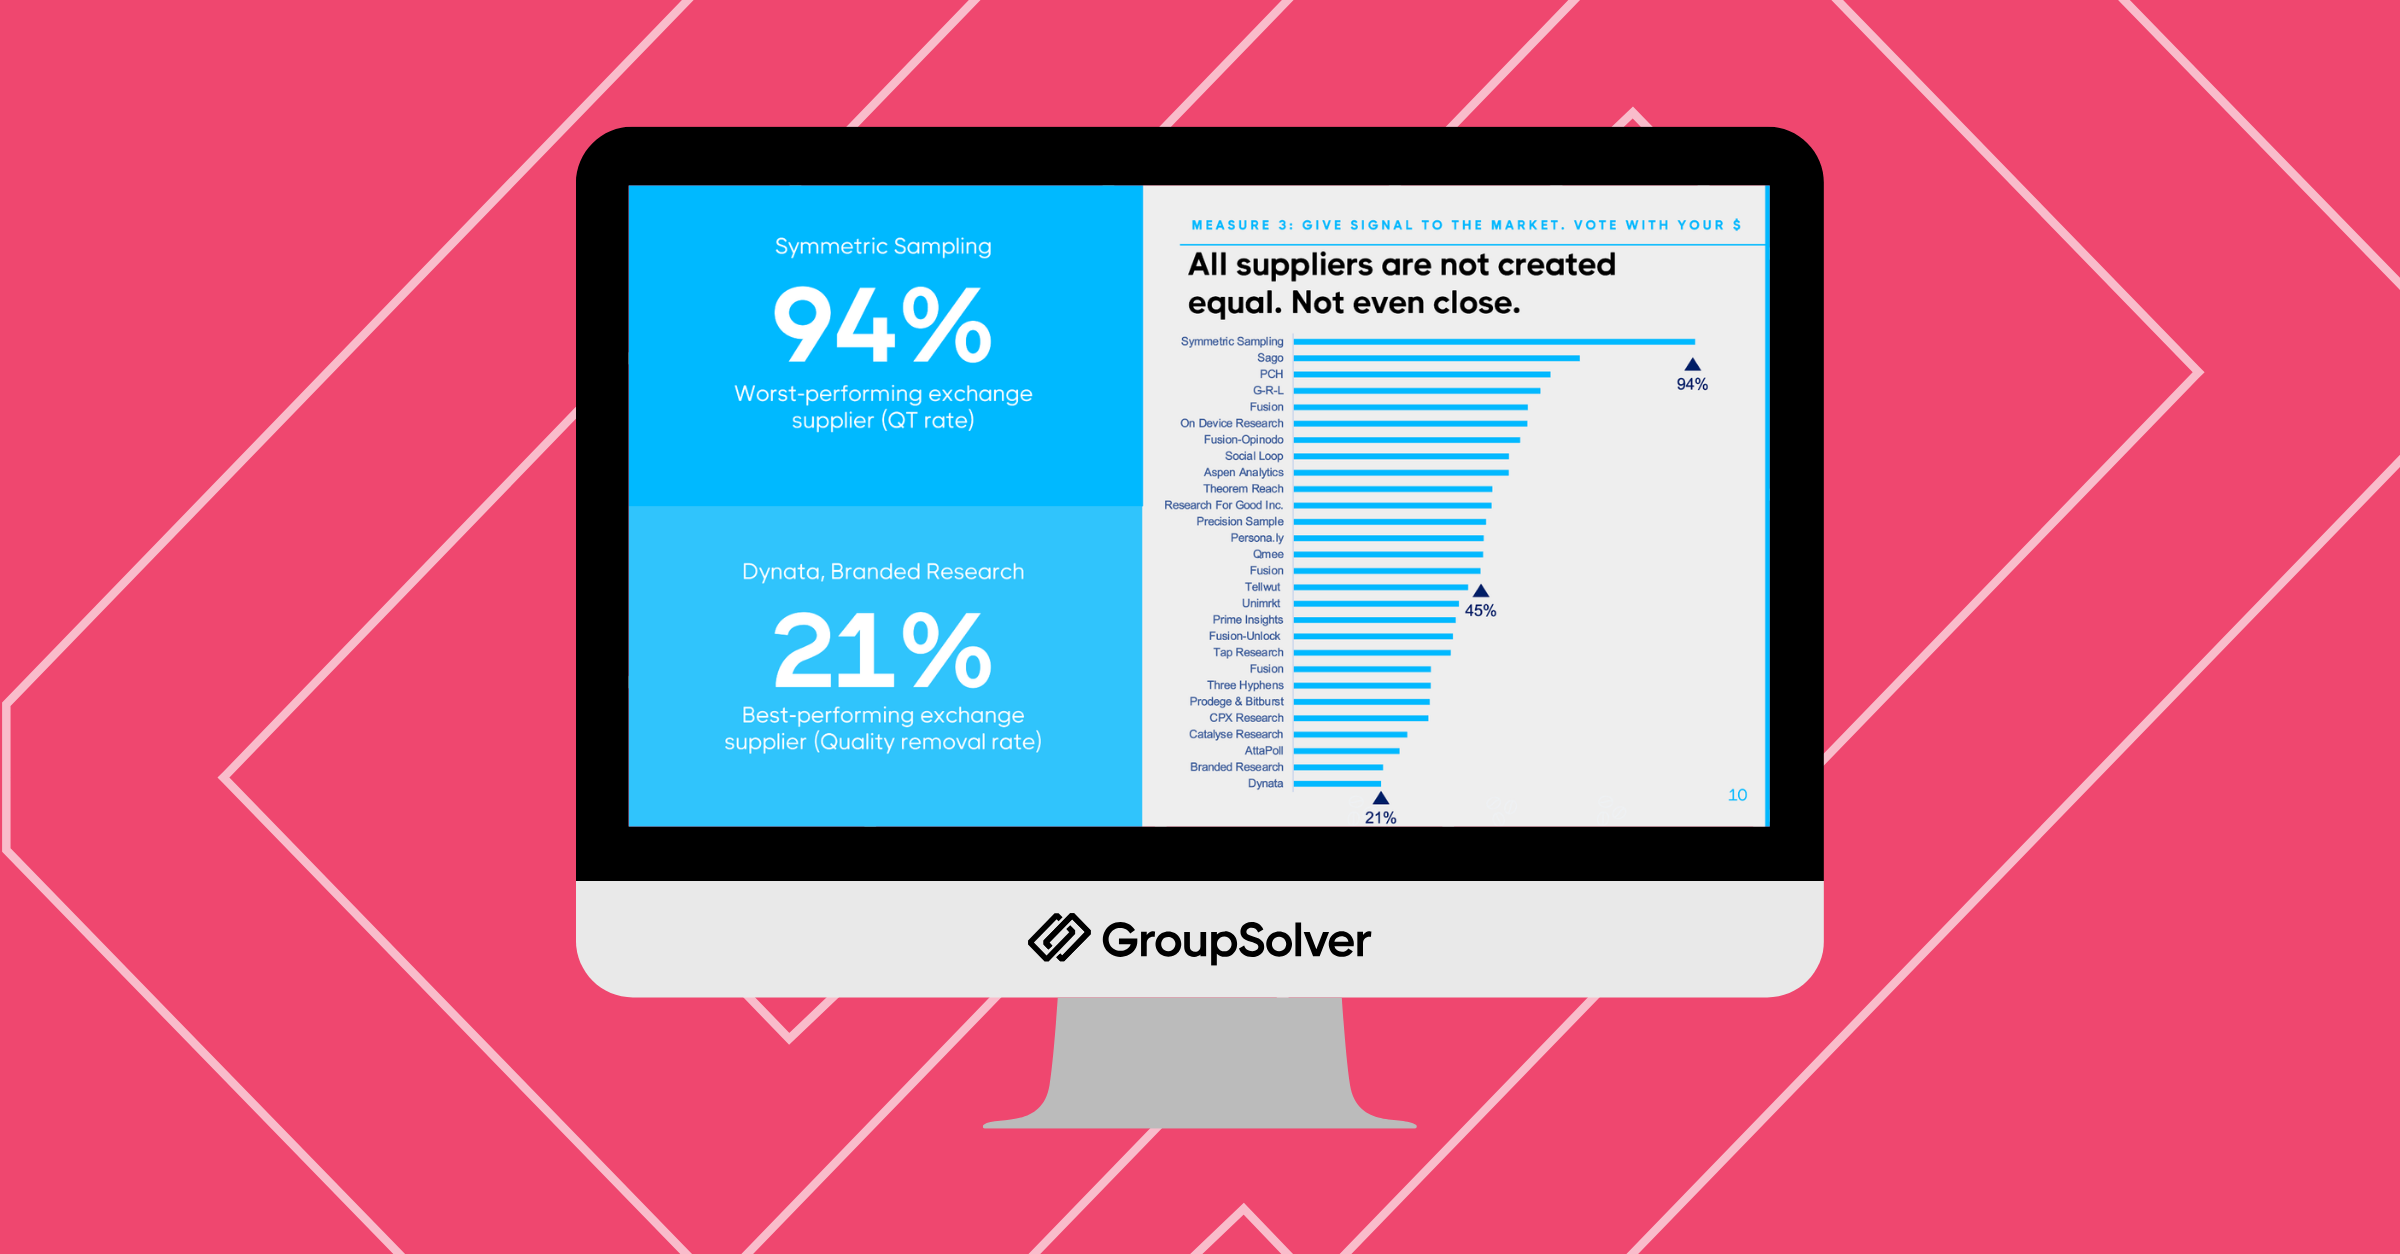
All suppliers are not created equal. Not even close.
Within a single panel exchange, in a single 12-month window, we measured quality removal rates that ranged from 21% at the best-performing supplier to 94% at the worst. The exchange-wide average sat around 45%.
A 94% removal rate isn’t a bad month. It’s a structural problem with that supplier’s panel hygiene. There is no good reason to keep accepting completes from a source where 19 of 20 respondents fail quality checks.
Our process is simple:
Track every removal back to the panel source
Review supplier-level performance monthly
Cut off suppliers with consistently bad data or worsening trends
Reallocate the budget to the cleaner sources
This is also where panel data quality becomes a market force. Every researcher who turns off a bad supplier sends a signal: clean data wins business, dirty data loses it. The industry’s bottom-tier suppliers only exist because clients keep paying them. Stop paying.
Want to see what 38% of bad respondents are doing to your data?
Measure 4: Make data quality a standard client deliverable
The most important measure is also the most underused. Every research report we deliver includes a data quality section: how many respondents entered, how many were removed, why they were removed, and what kind of fraud or inattentiveness was detected.
This serves two purposes. First, it forces transparency — clients see what dirty data looks like and start asking the same questions of every other research vendor they use. Second, and more importantly, it lets you connect quality removals to actual business decisions.
Here’s the proof case. We were helping a startup launch a new product, and pricing was a core question. Standard Van Westendorp price sensitivity analysis
. We ran the same data three ways: clean respondents only, all bad respondents combined, and the “less obvious” bad respondents — the ones who pass surface-level checks but fail deeper validation.
The optimal price point for the same product, from the same survey, varied dramatically by sample quality:
Clean respondents: $45
Less obvious bad respondents alone: $75
All bad respondents combined: $100
If the client had launched at the price the bad-respondent data suggested, they would have entered the market at roughly twice the price real customers were willing to pay. That’s a fatal launch mistake, the kind that kills a product before it gets a second chance. (Bad data costs real money
, and pricing distortion is one of the cleanest ways to see how much.)
This is what makes survey data quality an existential issue, not a theoretical one. Every report should answer the question: “What decision would this client have made if we hadn’t cleaned the data?”
The common mistakes sabotaging survey quality control
Even teams that take data quality seriously fall into a few repeating traps:
Relying only on pre-survey blockers. Pre-survey tools like reCAPTCHA and IP filters are useful, but they only catch what they can see before the survey starts. Most fraud and inattentiveness only becomes visible inside the survey itself.
Using the same attention checks for years. A trap question that worked in 2023 may pass every modern LLM. If you haven’t refreshed your attention check pool in the last six months, assume it’s leaking.
Terminating fraudulent respondents immediately. As covered above, this trains your enemy. Hold them until the end and waste their resources.
Treating supplier quality as a one-time decision. A panel that performed well last quarter may have degraded since. A monthly review is the minimum.
Hiding quality issues from clients. It feels uncomfortable, but transparency is the only thing that drives sector-wide pressure for cleaner data. Clients who see quality reports start demanding them from every research partner.
The contact-sport era of data quality won’t last forever. AI is shifting the economics. As clients increasingly use survey research to train models, build synthetic twins, and feed decision-support systems, the value of quality is going to outrun the value of volume.
Three predictions worth planning around:
Quality will outrun quantity. Training believable AI models depends on clean human data. Survey volume may shrink, but the value of each verified human response will rise.
High-quality first-party data becomes a competitive moat. Companies and research providers that can consistently deliver verified human responses will command premium positioning. Those who can’t will lose the work to synthetic data tools.
The low-CPI, low-quality sample market will collapse. When synthetic data is roughly as good as cheap survey data for non-critical decisions, the cheap-sample market loses its reason to exist.
The practical implication is the same for researchers and brand teams: invest in the people, processes, and tools that produce verified data now, before the market reprices around them. (See how GroupSolver approaches verified data end-to-end.
)
Key takeaways
Survey data quality removal rates climbed from a 12-month average of 38% to a 6-month average of 45% — fraud and inattentiveness are systemic, not anomalous
A single B2B study saw 69% of “completes” fail quality checks, signaling industry-wide contamination
Use at least two attention checks, three open-ended questions, and one logic check per survey
Modern survey trap questions must be designed to exploit LLM blind spots, not just human inattention
Quality-terminate bad respondents at the end of the survey, never immediately, to avoid teaching them how to pass
Audit panel suppliers monthly; quality removal rates vary from 21% to 94% within a single exchange
Include a data quality report in every client deliverable to make consequences visible and align market incentives
Bad data can shift a Van Westendorp optimal price by 50–120%, turning a viable launch into a fatal one
FAQ
A bad survey respondent is anyone whose answers don't reflect a genuine, attentive human matching your target audience. Today, that includes AI-generated responses from LLMs, bot networks running automated scripts, click-farm workers cycling through panels for income, and inattentive humans rushing through surveys without engaging. All of them produce data that looks complete but distorts results.
Layer your defenses. Use modern survey trap questions designed to exploit LLM tendencies, such as making "I don't know" the correct answer to an obscure factual question. Add open-ended questions to test language patterns, and include logic checks that verify consistency across the survey. Test these monthly against current AI tools. Real humans pass without friction; bots and AI-assisted respondents fail.
Immediate termination tells the fraudster exactly which question caught them, so they refine their approach and try again. Letting them finish the survey before quality-terminating preserves your detection signals, wastes their time and AI tokens, and gives real respondents more time to fill quotas. Panel reconciliation works at the end if you have the evidence.
Monthly is the minimum. Panel quality drifts as suppliers source from new sub-panels, and a vendor that performed well last quarter may degrade quickly. Track quality-removal rates per supplier, set a threshold for action, and reallocate budget toward your top performers. The goal is to vote with your dollars and reward suppliers that produce clean human data.
At minimum: total respondents who entered the survey, breakdown of removals by reason (failed attention check, AI-generated language, logic inconsistency, panel-flagged) and an interpretation of how removals affected the final results. The strongest reports also model what business decisions would have looked like if the bad respondents had been included. That's what turns data quality from an abstract concern into an existential one.
Ready to see what your data looks like without the bad respondents?
Surveys aren’t getting cleaner on their own. The fraud is more sophisticated, the AI is more capable, and the panel economics still reward volume. The researchers who will produce trustworthy data over the next few years are the ones treating data quality as a contact sport — designing for it, measuring it, reporting it to clients, and adjusting monthly. The four measures here are the minimum kit.
Stay curious. Ask why your data looks the way it does.