Quantifying qualitative survey data often becomes an exercise of “let’s just get finished with it,” but looking for nuance in answers to open-ended question can tell us something distinctive about specific segments of respondents. I recently witnessed this when I was showing our platform to one of our partners. I was walking her through a routine demo of the different visualization tools we have, when I finally opened up the IntelliSegment™ chart. While explaining how it works, I recognized the look of surprise in her eyes (through zoom, no less) when she saw how quickly I could slice the qualitative data by different target audiences. It’s game_ _changing. Now I want to share IntelliSegment™ with all of you.
What is IntelliSegment™?
Many survey platforms—us included—can cut close-ended data based on pre-defined customer audiences or segments like gender, age, race, and income level. But what about slicing open-ended data by the same segments? This is where traditional survey platforms fall short. In a recent piece
, we shared how our AI Open-End™ questions differ from traditional open-ended text boxes in that we can quantify the qualitative data that we capture. Our platform automatically calculates support strength for open-ended answers, and it can differentiate that support for different respondent segments. This helps our customers understand not only the ‘what’ that is specific to certain customer groups, but also the ‘why’ behind it as it applies to different groups of customers.
When I talk about IntelliSegment™, I often describe it as finding_ a needle in a haystack__ using a massive magnet_. Analyzing open-ended responses on our platform provides rich, insightful data out of the box, but sometimes we want to apply the emerging story to a specific type of customer. Figuring out how different customer segments feel towards certain statements can help paint a more accurate, nuanced picture and tell a more precise story. This is the needle you have been looking for.
IntelliSegment™ in real life.
Since early March we have been tracking consumer sentiment and behaviors in response to COVID-19 through a series of pulse checks (see: most recent report
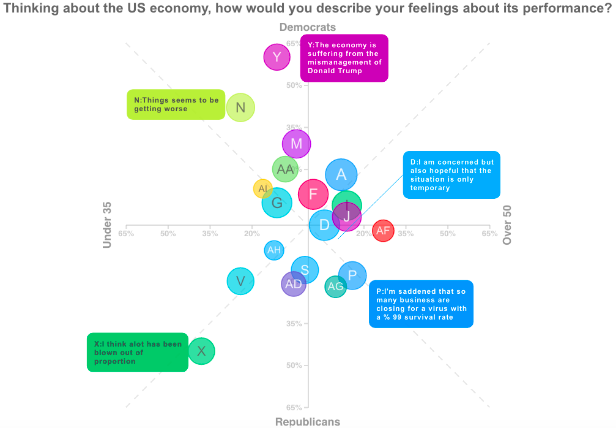
). One of the ways we have been able to understand how different groups of people react to the pandemic and its consequences is by analyzing the data we collect in IntelliSegment™. For instance, one question we asked in our latest pulse check was about people’s feelings towards the economy’s performance during COVID-19. Given that this oftentimes turns into a political debate, I decided to compare support between self-identified Democrats and Republicans, as well as between younger Americans (under 35 years old) and older Americans (over 50). This tool reveals that there are a few statements that certain groups feel more strongly about.
 IntelliSegment™
Certain bubbles are situated in different quadrants while some are closer to a specific axis. When they are located in the middle of quadrants, far away from the intersection of the two axes, it means that this segment supports the idea more than the other segments. For example, younger Republicans feel that this issue has “been blown out of proportion”(Bubble X: 81% Republican support vs. 36% Democrat support & 67% support for those under 35 vs. 29% support for those over 50). On the contrary, younger Democrats believe that “things seem to be getting worse”(Bubble N: 80% Democrat support vs. 38% Republican support & 66% support for those under 35 vs. 42% support for those over 50). You also have older Republicans who are **“saddened that so many business[es] are closing for a virus with a 99% survival rate” **(Bubble P: 74% Republican support vs. 56% Democrat support & 75% support for those over 50 vs. 59% support for those under 35).
IntelliSegment™
Certain bubbles are situated in different quadrants while some are closer to a specific axis. When they are located in the middle of quadrants, far away from the intersection of the two axes, it means that this segment supports the idea more than the other segments. For example, younger Republicans feel that this issue has “been blown out of proportion”(Bubble X: 81% Republican support vs. 36% Democrat support & 67% support for those under 35 vs. 29% support for those over 50). On the contrary, younger Democrats believe that “things seem to be getting worse”(Bubble N: 80% Democrat support vs. 38% Republican support & 66% support for those under 35 vs. 42% support for those over 50). You also have older Republicans who are **“saddened that so many business[es] are closing for a virus with a 99% survival rate” **(Bubble P: 74% Republican support vs. 56% Democrat support & 75% support for those over 50 vs. 59% support for those under 35).
Sometimes, respondents in several segments agree and those statements align near an axis. “The economy is suffering from the mismanagement of Donald Trump” is a statement at the top of the Y axis, meaning that it is most significantly supported by Democrats (Bubble Y: 79% Democrat support) of all ages. In addition, just like you can visually see which segments support certain statements compared to others, you can also see which bubbles are located closer to the center.“I am concerned but also hopeful that the situation is only temporary” is right in the center of both axes, meaning that all groups in general agree with this answer (Bubble D: 81% total support strength).
So what?
Using visualization tools like IntelliSegment™ deliver a better story and help answer the “so what?” question with detail. Just like I have been using IntelliSegment™ to understand sentiments about coronavirus across different people, our customers have used it in their own ways. One client found emerging themes about feelings towards back-to-school depending on whether the children’s parents worked from home or not. Another client uncovered why Millennials liked a certain recreational activity versus Gen Z. And another client discovered how social media usage differs based on age and racial background. The result is more actionable insights that will guide you to a better understanding of your customer.
Balbina De La Garza, Marketing Coordinator at GroupSolver