Since the beginning of the COVID pandemic, we have been taking a periodic pulse of the US population hoping to track how our feelings and perceptions evolved over time. We took our first pulse check almost a year ago as the pandemic really started to grip our society.
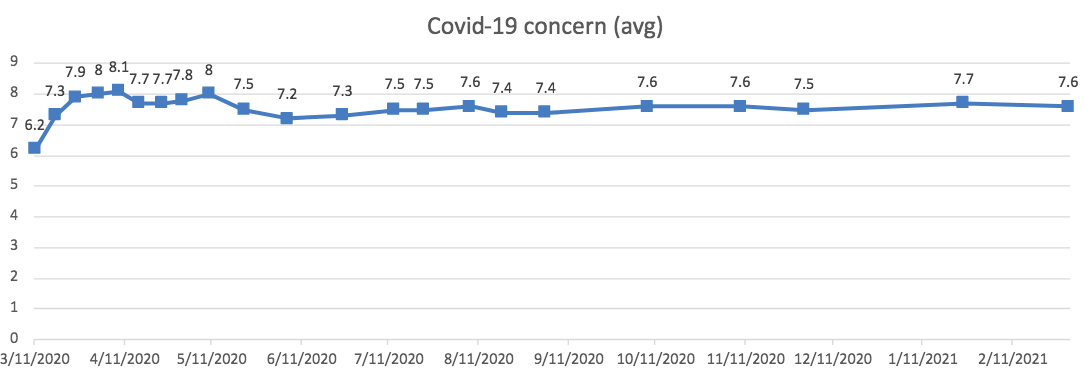
On the scale from 1 (not at all concerned) to 10 (extremely concerned), the concern quickly accelerated from the average of 6.2 to 8.1 in a span of 4 weeks. As the virus spread, and we got through the initial adjustment period, our concern about Covid slowly settled and it has remained in the 7.5 range since the end of May. We were curious if this concern subsides with the vaccine production and distribution ramp-up, but so far, we have not seen any change in the recorded sentiment.
Level of concern is also reflected in our expectation of when the life will return to normal. In this next question, we asked respondents to estimate how many more weeks it will be before life returns to normal.
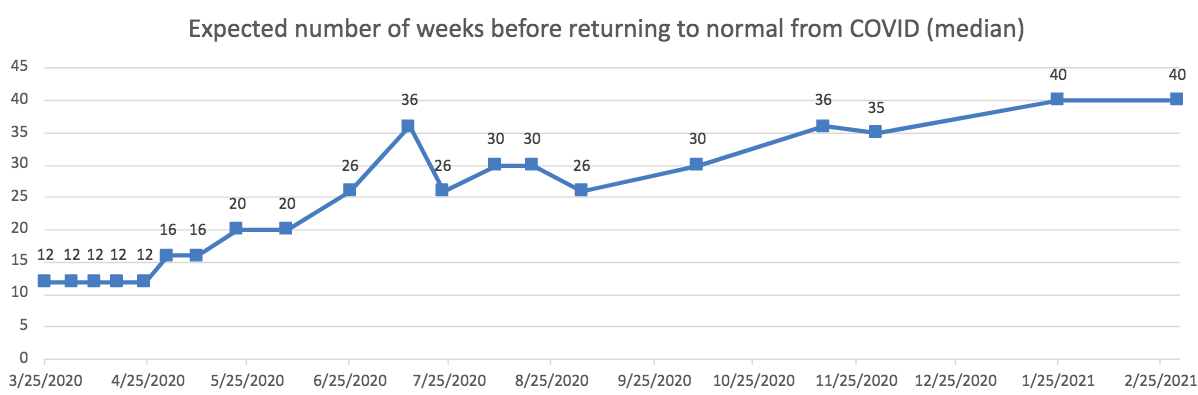
The story of our concern level shows a quick increase and then continued elevated level of concern, just as the story of our “return to normalcy” expectations show gradual realization that “this will take a while.” Early on, through the end of April, median expectation was that after 3 months life will return to the usual. As that became increasingly less and less likely, our expectations adjusted… and they continue to adjust. Even today, with the vaccination in progress and COVID cases in decline, our expectations are that we will be well into the fall of 2021 before we put the masks away. Has the malaise of COVID restrictions made us more pessimistic about the future? Alternatively, are we just adjusting our expectation rationally from practical experience? We expect that at some point, perhaps when the perspective of achieving the heard immunity becomes within reach, we will see a pendulum swing and the curve will come down as fast as it came up.
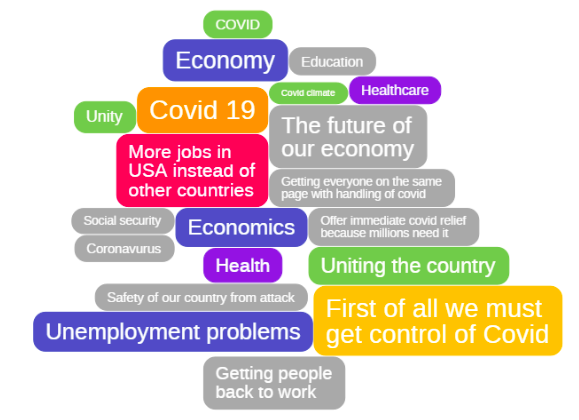
COVID remains top of mind for the agenda of the new US government. When we asked what top policy priority our respondents had for the Biden administration, getting control of Covid had about 80% support strength, followed by the Economy (75% support strength), unemployment and jobs (73% support strength). Also high on the list – uniting the country, which was another request by our respondents. It was supported by about 70% them.
 IdeaCloud™
Staying with the theme of checking in on how we are feeling, we also wanted to take a quick pulse of current feelings toward the 2020 presidential elections. There is no disputing that these elections have polarized the population and we wanted to see if the raw emotions remain high or if we have started marching toward unity.
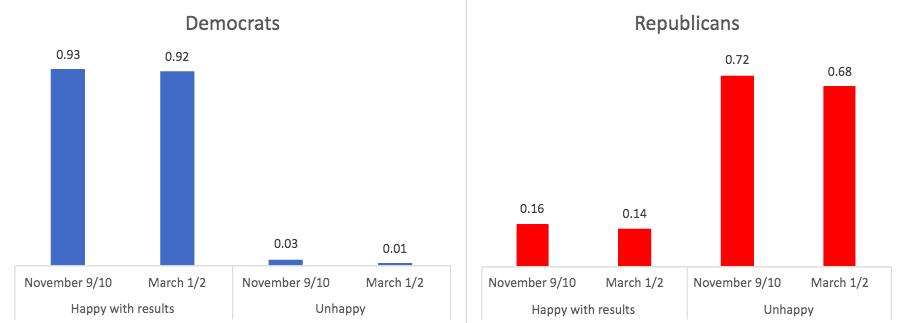
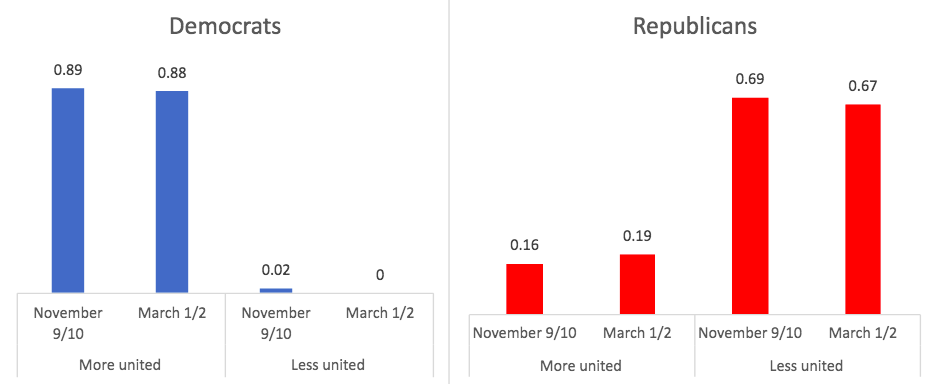
Three months after the elections, Democrats’ and Republicans’ feelings about the election results remain about the same. Similarly, while the idea of unity as an important policy came out strongly as a response to an open-ended question, Republican respondents are not yet convinced that at the end of Biden-Harris term, the country will be more united… although an optimist may see a small uptick in the data (which our statisticians would unfortunately quickly refute).
We will close this quick update with one piece of good news, which even our statisticians will not reject: the nation is slowly getting over the claims of the 2020 election being rigged. While the majority of our Republican respondents still believe the rigged claim, their number has dropped. While in this case, statistical significance paints a rosier picture that the actual magnitude of the change, we will take this as a good sign, nevertheless.
In the future weeks, we will be taking a look at some of the industries that were affected by the pandemic and we will explore social issues such as homelessness and unemployment to dive deeper into the effect of the COVID pandemic as we are entering Year 2 of the new normal.