After a drawn-out battle between former Vice President Joe Biden and President Donald Trump, America has chosen Joe Biden as its 46th president. In his victory speech, Biden stated that the American people have “delivered us a clear victory, a convincing victory, a victory for we, the people.”
At the same time, his opponent took to Twitter saying, “I WON THIS ELECTION, BY A LOT!” These contradicting messages perfectly capture the political environment of America: a deep division rooted in misinformation and convenient fictions. Without agreed-upon facts, the nation has fostered a political climate in which the possibility of consensus has become nearly impossible. Our post-election study with over 330 respondents reiterates America’s division with its polarizing data. In this survey, we not only asked what people felt about the results of the elections, but also why they felt that way.
Pre-Election Expectations
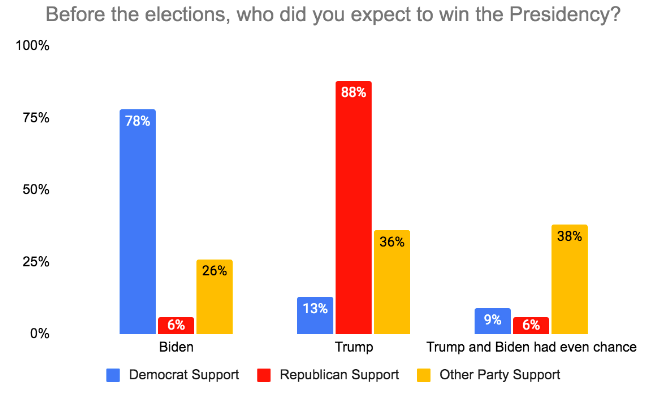
As Americans on both sides of the political spectrum are continually presented with contradictory news headlines, it comes as no surprise that their expectations for the outcome of the 2020 presidential election varied drastically. Prior to election day, 78% of Democrats expected Biden to win while 88% of Republicans expected Trump to win. These passionate predictions may be largely attributed to the opposing media consumed by both parties. Those who believed Biden and Trump had an even chance for the presidency showed up in exceptionally lower numbers, with only 9% of Democrats and 6% of Republicans.
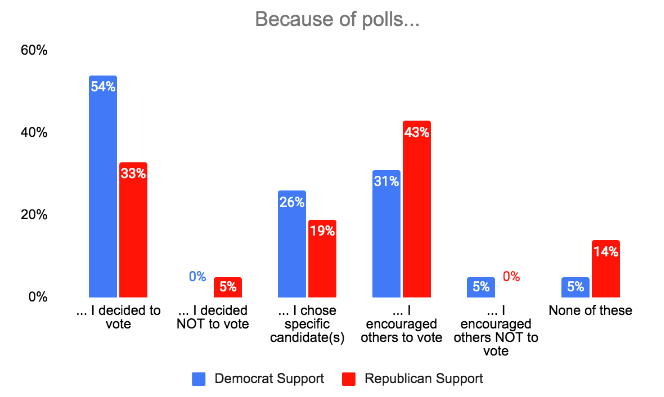
Polls have proven themselves to be unreliable
, however, 22% of respondents indicated that their voting behavior was impacted by pre-election polls and predictions. Republicans and Democrats who indicated poll-inspired behavior changes acted in different ways. 54% of Democrats decided to vote because of polls. Democrats seem to have been inspired by the polls to vote, internalizing the predictions and acting upon it themselves. 43% of Republicans, on the other hand, encouraged others to vote because of polls. This could very well be indicative of why the Republican voter turnout was so large.
Fraudulent Feelings
President Trump has yet to concede due to his suspicion of electoral fraud. He has initiated numerous lawsuits despite having almost no evidence
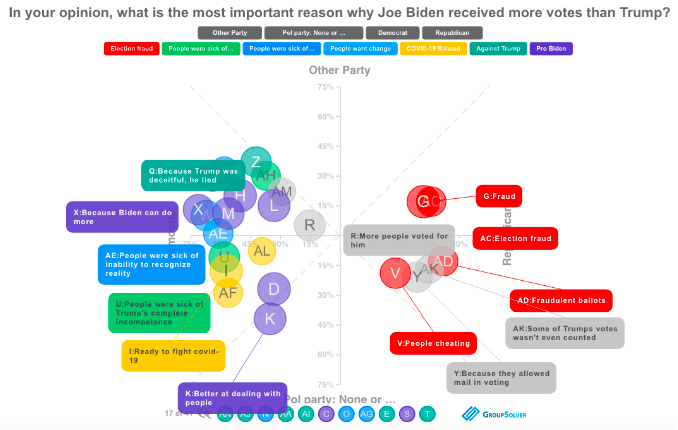
that points to a fraudulent result. Our data, once again, presents divided opinions, as 81% of Republicans believe the 2020 presidential election involved substantial cheating that had a material impact on the outcome of the election, while 85% of Democrats believe it did not. The data shows Democrats and Republicans to be deeply divided on why they believe Joe Biden earned more votes than Donald Trump, as presented in the visualization below. The trends are clear: Republicans believe Biden’s victory is a case of fraud and cheating, while Democrats believe that the American people found him to be the better candidate on various issues.
 IntelliSegment™
The data presents mixed feelings among Democrats, providing statements that indicate messages of “Pro-Biden” versus “Against Trump”. For example, 87% of Democrats believe Joe Biden received more votes because he is “ready to fight covid-19″ and 85% believe the victory was due to Biden being “
IntelliSegment™
The data presents mixed feelings among Democrats, providing statements that indicate messages of “Pro-Biden” versus “Against Trump”. For example, 87% of Democrats believe Joe Biden received more votes because he is “ready to fight covid-19″ and 85% believe the victory was due to Biden being “
better at dealing with people
”. On the other hand, 85% of Democrats indicated that Biden won because “Americans are tired of Trump” and another 81% agrees that “
people were sick of Trump’s complete incompetence”. So, there is even a little bit of divide between why Democrats believe Biden won! Republicans provide a greater consensus among themselves as to why they believe Biden received more votes. Popular statements among Republicans include “
s
ome of Trump’s votes weren’t even counted” with a 78% support strength among Republicans and “
f
raudulent ballots” with an 81% support strength among Republicans.
What will the next 4 years look like?
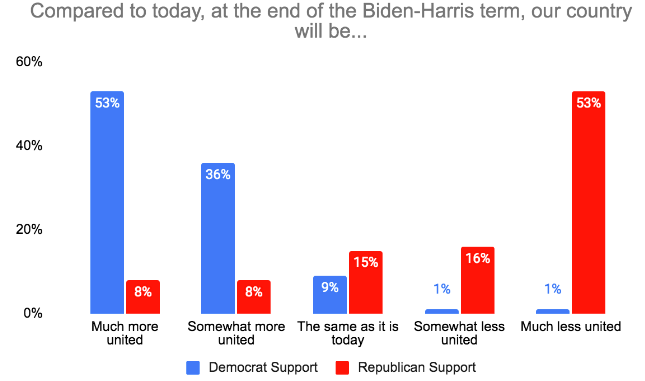
America is craving unity more than ever. But then why is it hard to put party aside? Some believe that the Biden-Harris administration will provide harmony while others are skeptical. The chart below clearly visualizes the polarization of opinions on the Biden-Harris administration and their ability to unify the country. Compared to where our nation is today,** 53% of Democrats and only 8% of Republicans believe our country will be much more united by the end of the Biden-Harris term**. Republican’s skepticism towards Biden will undoubtedly create challenges not only for the new administration, but for the country as a whole, as it will be increasingly difficult for both parties to reach a consensus.
How can we get back to “One nation, indivisible?”
Respondents’ reasons for voting for their candidate emphasize the country’s division, revealing passionate opinions from both sides. Democrats chose Biden for change, less hate and opposition, and for the removal of Trump. Republicans believe that Trump is best for the economy, freedom, and the American people. It is clear that it will take a lot of work before we can get back to somewhat common ground. The true test will be: can we do this in the next 4 years?